In Short: How Do You Administer a Fabric Capacity?
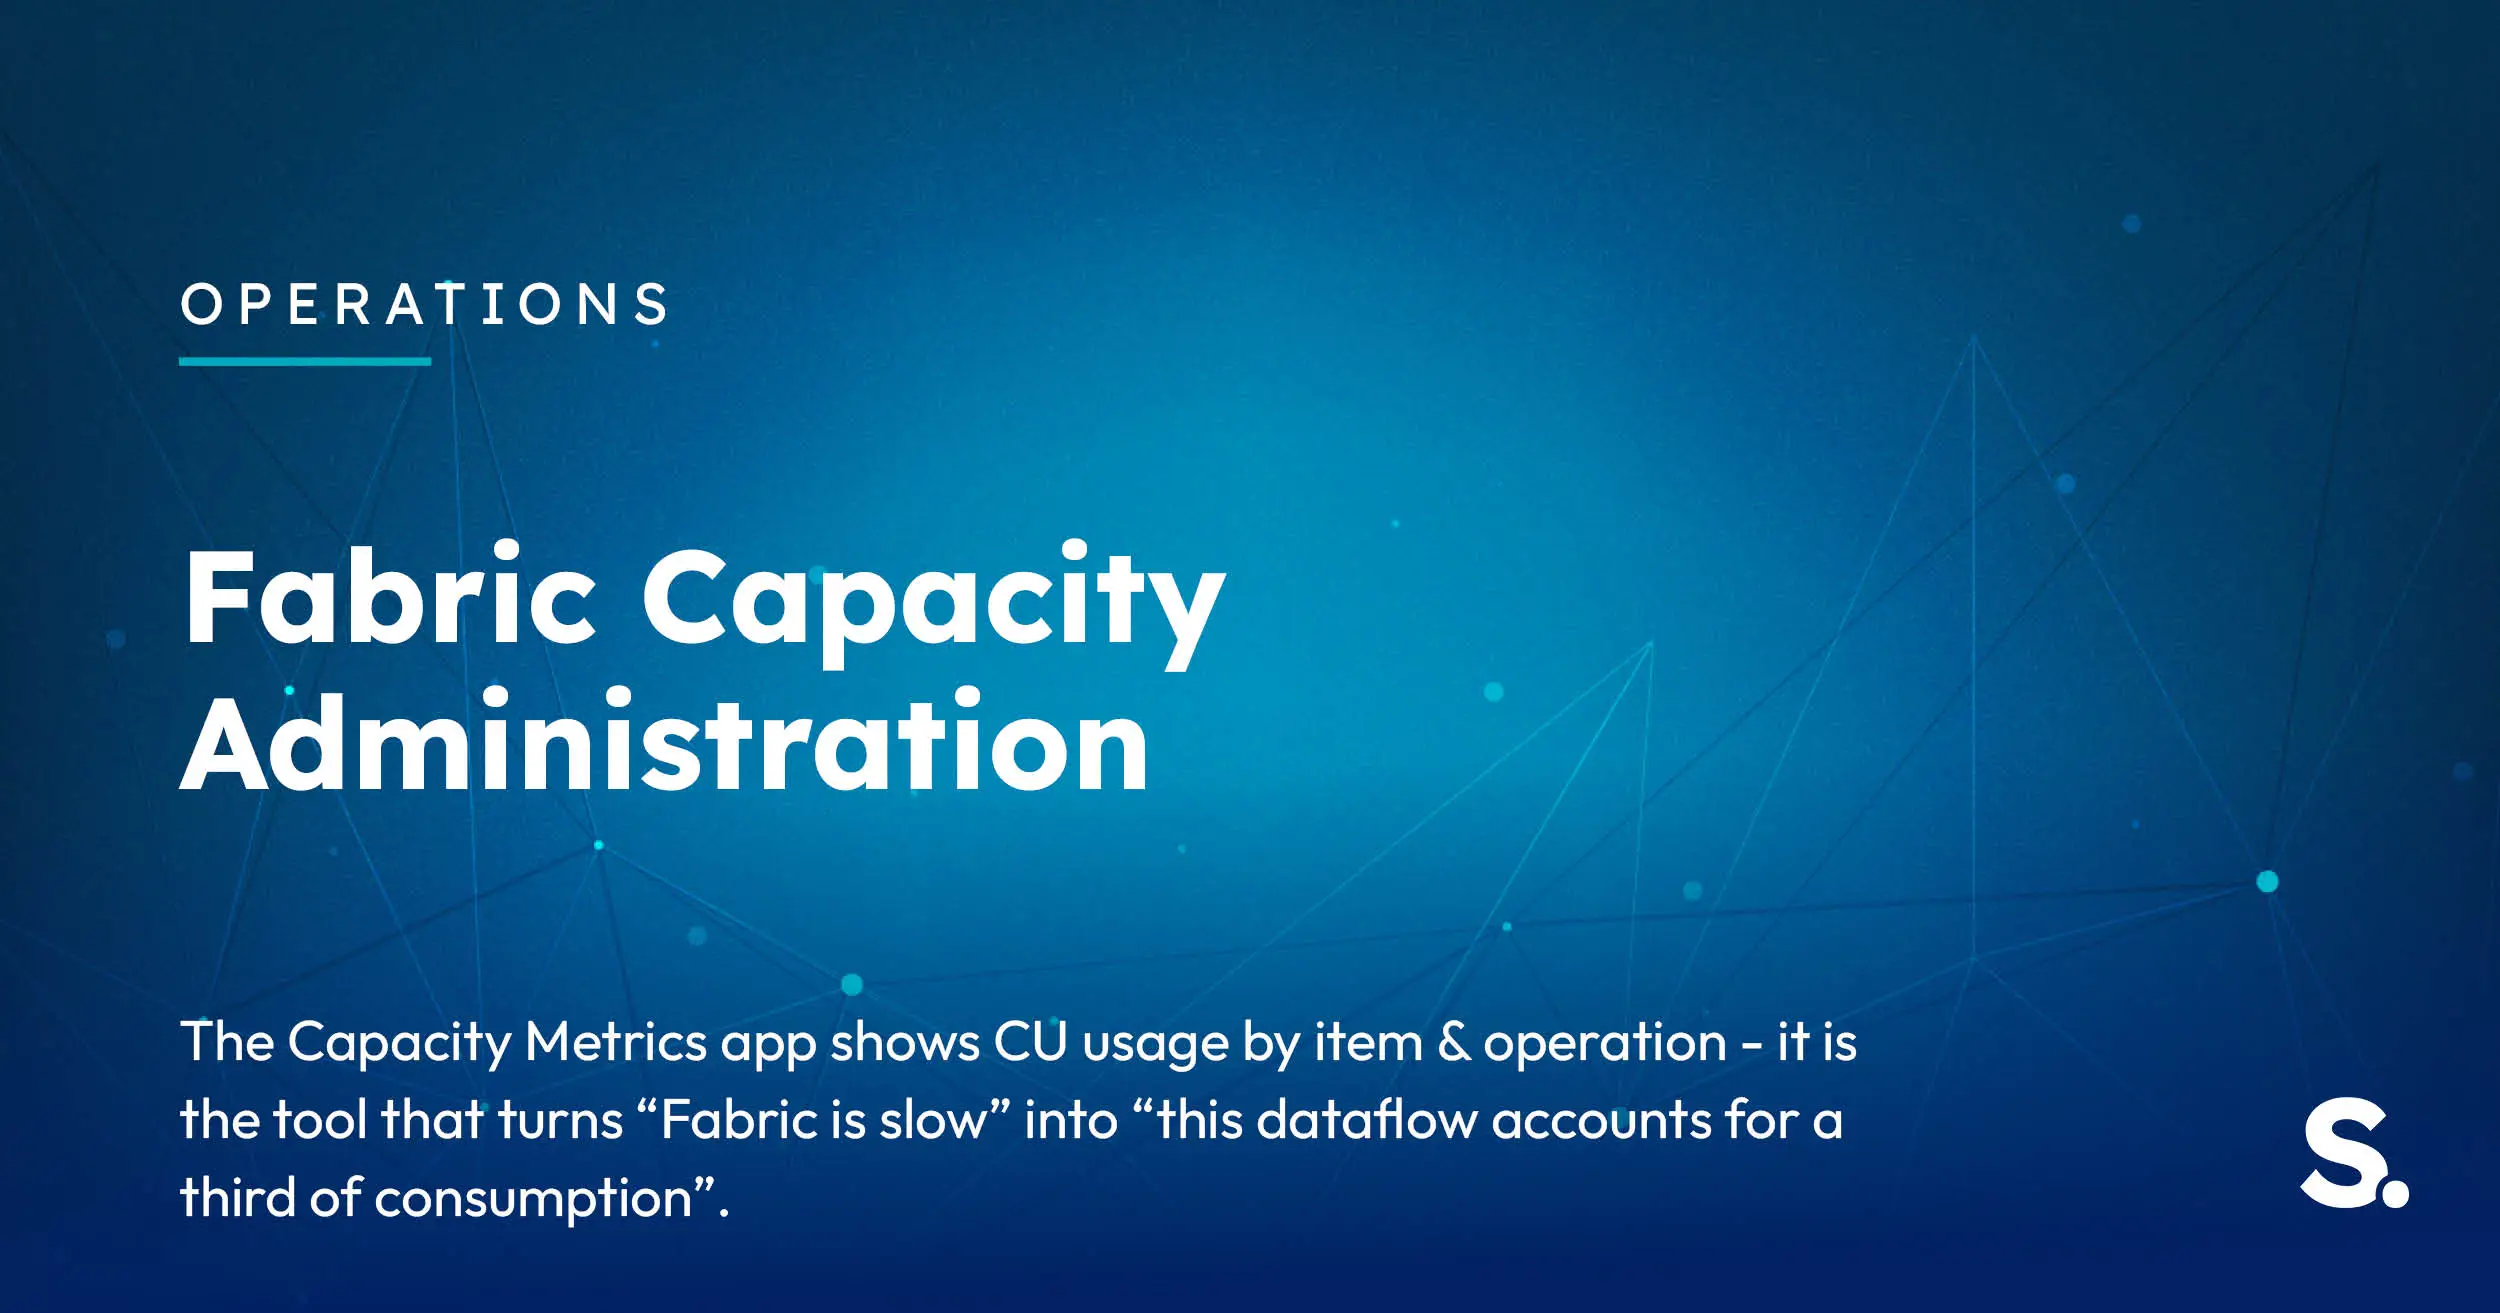
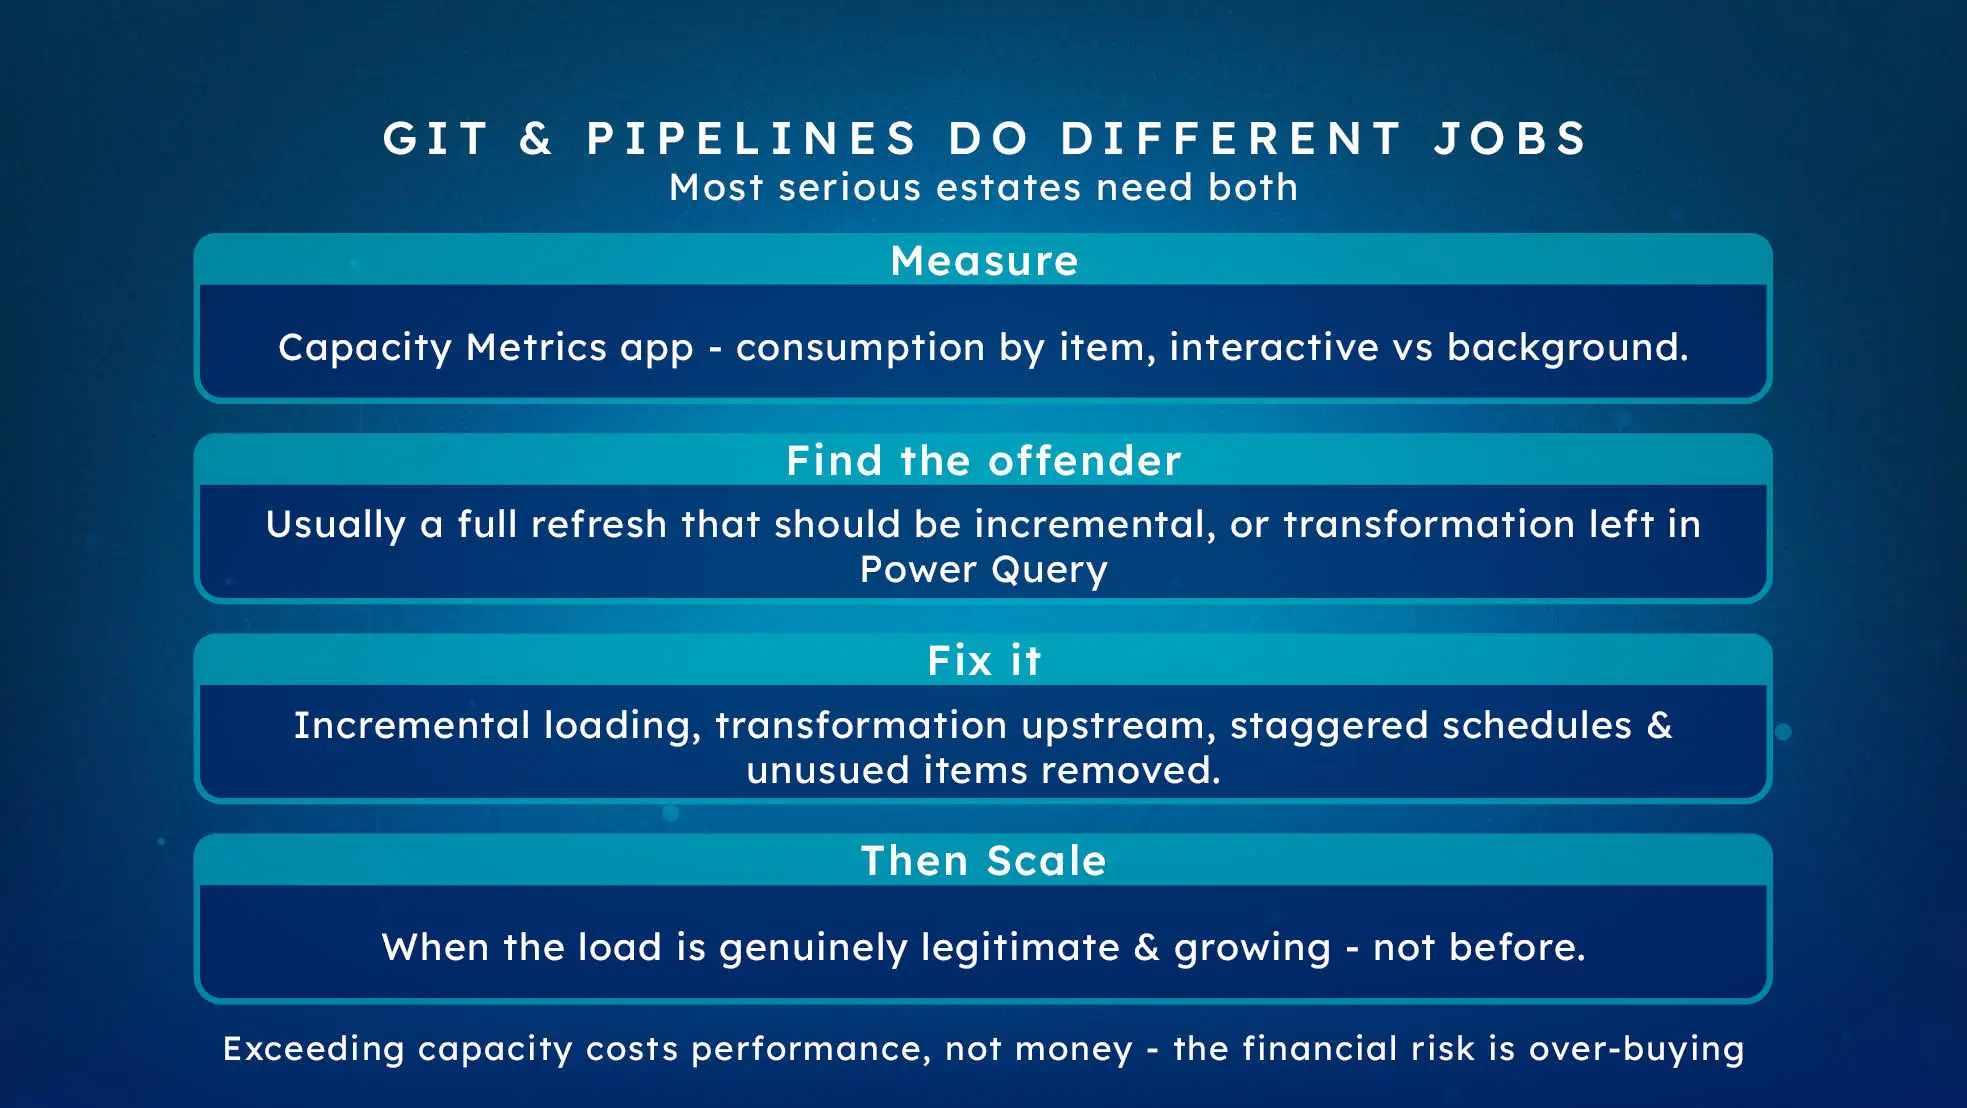
Watch consumption, find the item responsible, optimise before scaling. The Capacity Metrics app shows CU usage by item and operation - it is the tool that turns "Fabric is slow" into "this dataflow accounts for a third of consumption". Alert on sustained utilisation and throttling rather than brief spikes, because absorbing spikes is what smoothing is for.
Sizing Versus Administering
Choosing an F SKU is a buying decision made once. Administering it is continuous, and it is where most of the money is actually won or lost - a well-run F16 outperforms a badly-run F32 for less.
If you have not yet chosen a SKU, start with capacity sizing. This picks up afterwards.
The Capacity Metrics App
Install it, and give it fifteen minutes a fortnight. The compute page is where the useful detail lives.
Three things to read:
The utilisation timeline. Consumption against your capacity over time. You are looking for shape, not peaks - a line that sits near the ceiling for hours is a different problem from one that touches it briefly at 6am.
Consumption by item. Which dataset, pipeline, notebook or report is responsible. This is the view that ends arguments, because it names the artefact rather than the platform.
Interactive versus background. Background operations - scheduled refreshes, pipelines - are smoothed over a long window. Interactive operations - report queries - over a short one. A capacity comfortable overnight and throttled at 9am has an interactive problem, and the fix is different.
Understanding Throttling
Fabric does not fail the instant you exceed capacity. It smooths consumption over time, absorbing bursts. Sustained overuse leads to delay, and eventually rejection.
Two consequences worth internalising:
Overuse can cost money as well as performance - check each capacity's overage setting. Without paid overflow, exceeding a capacity costs performance rather than budget, and the financial risk in Fabric is over-buying. Capacity overage, generally available since September 2026, changes that: excess usage that would otherwise be throttled is billed on a separate meter at three times the pay-as-you-go rate, and is not eligible for reservation discounts. Microsoft's documentation is inconsistent on the default - the Learn page calls overage an opt-in feature, then says it "is enabled by default when you create a Fabric capacity" - so confirm the setting on every capacity you administer. Its rolling 24-hour threshold is "a spending threshold, not a hard spending cap", and work already running can push charges past it. On-demand billing, coming soon, adds its own spend limits. Set both as carefully as you choose the SKU; see capacity overage explained.
Throttling arrives late. Because smoothing hides the early symptoms, by the time users complain the cause has usually been building for days. This is precisely why the fortnightly look at the metrics is worth more than reacting to complaints.
Optimise Before You Scale
When consumption is high, the reflex is a bigger SKU. Check the item breakdown first, because in most estates a small number of items account for a disproportionate share.
Common offenders and their fixes:
- A dataset doing full refresh where incremental would do. See our incremental refresh guide - frequently the single largest saving available.
- Transformation happening in Power Query rather than upstream. Move it into a pipeline; it stops being paid for on every refresh.
- An oversized model with unused columns. Covered in report performance.
- Refreshes stacked at the same time. Staggering costs nothing and often removes the peak entirely.
- A notebook someone left scheduled after a project ended. More common than it sounds.
Scaling is the right answer when load is legitimate and growing. It is the expensive answer when one item is misbehaving, because you carry that cost for the whole reservation term.
Update, 29 September 2026: Microsoft announced new capacity controls at FabCon Europe 2026. Workspace-level surge protection, generally available soon, sets a consumption limit per workspace so runaway or non-critical work cannot throttle the whole capacity, with mission-critical workspaces exempt. Capacity Insights & Actions in the refreshed Monitor Hub (preview) lets you adjust surge and overage settings, migrate workspaces or resize from one place, and the Capacity Metrics app gains health-state duration, heatmaps and top item contributors (generally available). On-demand billing, when it arrives, adds an On-demand compute tab per billing category; see Fabric F0 and on-demand billing explained and our FabCon Europe 2026 recap.
What to Alert On
Keep it narrow, or alerts get ignored:
- Sustained utilisation above a threshold you set deliberately - not a brief spike.
- Any throttling event. These should be rare enough to be worth investigating individually.
- Refresh failures, routed to a monitored channel rather than an individual's inbox - see refresh failures.
Resist alerting on peaks. Fabric is designed to absorb them, and an alert that fires every morning trains people to dismiss it.
Development Capacity
Building on the production capacity works until a badly-written notebook throttles live reporting during the working day.
The standard arrangement: a reserved production capacity, plus a small pay-as-you-go capacity for development that is paused outside working hours - roughly a quarter of the always-on cost. It also gives you somewhere safe to test the thing you suspect is expensive.
This pairs with a proper environment strategy, which is the other half of the same discipline.
A Quarterly Rhythm
Enough for most estates:
Read the trend. Is consumption rising, and does it track adoption or something unexplained? Check the top consumers. Has anything new appeared near the top? Review the SKU. Adoption grows; a SKU right at launch is often wrong a year later - sometimes too small, occasionally too large. Confirm the reservation still fits before it renews.
Where Solv Systems Comes In
We run capacity reviews both as part of our Fabric engagements and standalone, for organisations already running a platform who suspect they are on the wrong tier or paying for inefficiency.
The work is mostly forensic: instrument the estate, read the metrics honestly, find what is actually consuming the capacity, fix it, then recommend a SKU. It fairly often ends with a recommendation to buy less than the client expected, which is generally the sign the exercise was worth running.
Sources and Further Reading
- Capacity Metrics app compute page
- Fabric smoothing and throttling
- Build, deploy, and govern Microsoft Fabric at scale
Frequently asked
The Microsoft Fabric Capacity Metrics app. Its compute page breaks consumption down by item and operation, so you can identify the specific dataset, pipeline or notebook responsible. It is the single most useful administrative tool on the platform and it is free.
Operations slow and then start being delayed or rejected. Because Fabric smooths usage over time, throttling follows sustained overuse rather than a single spike - which means by the time users complain, the cause is usually something that has been growing for days.
Optimise first, almost always. It is common for one inefficient item to account for a large share of consumption, and fixing it saves a SKU tier - which over a reserved year is real money. Scale when the load is genuinely legitimate and growing.
Sustained utilisation above a threshold you have chosen deliberately, any throttling event, and refresh failures. Alerting on brief spikes generates noise, because absorbing spikes is what smoothing is for.
Pay-as-you-go capacities can be paused, and a development capacity running only in working hours costs roughly a quarter of an always-on one. Reserved capacities cannot be paused, which is why the usual pattern is reserved production plus a small pausable capacity for development.
Quarterly as a baseline, and after any significant change in usage or content. Consumption grows as adoption grows, so a SKU that was right at launch is often wrong a year later - in either direction.