
In Short: Why Is Your Power BI Report Slow?
One of four things: the model, the DAX, the visuals, or the source. Diagnose which before changing anything - most wasted optimisation effort goes into the wrong layer. Performance Analyzer splits each visual's load time into DAX query, visual display and other, which tells you where to look in about five minutes.
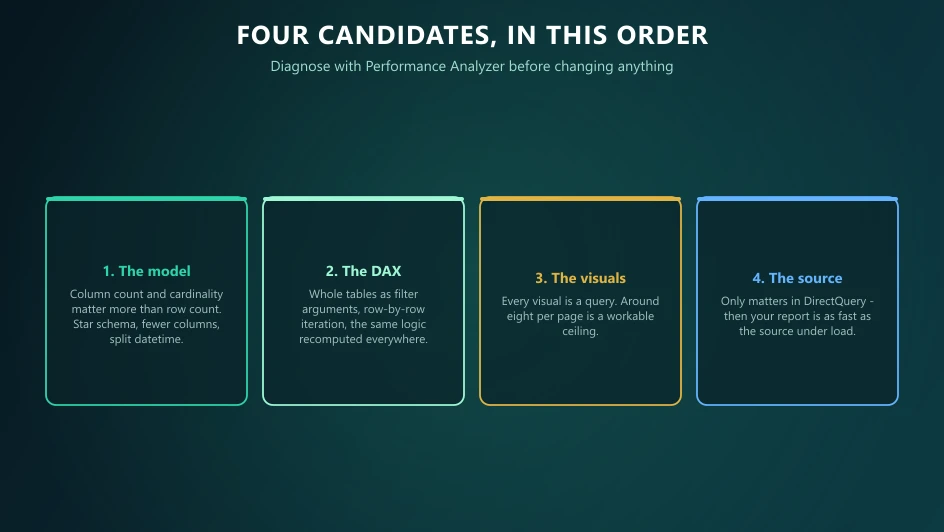
Diagnose in the Right Order
Performance work goes wrong when it starts from a guess. Somebody rewrites DAX for a week when the actual problem was thirty visuals on a page, or buys capacity when the model has a column with two million distinct text values in it.
Open Performance Analyzer in Desktop, start recording, refresh the visuals, and read the breakdown:
- DAX query dominant - the measure or the model is the problem.
- Visual display dominant - too many visuals, or a heavy custom visual.
- Other dominant - usually waiting on other queries, which points at page design or concurrency.
For estates rather than single reports, Microsoft's performance monitoring guidance covers the wider tooling.
Cause 1: The Model
This is the most common root cause and the least often suspected, because a model problem presents as slow DAX.
Column count matters more than row count. The engine compresses column by column, so a hundred million rows across ten well-chosen columns often outperforms a million rows across two hundred columns.
High-cardinality columns are the expensive ones. A text column with millions of distinct values - transaction IDs, free-text notes, full timestamps - compresses badly and inflates memory. Two fixes recur: remove what you never group or filter by, and split datetime into a date column and a time column, which turns one enormous cardinality into two small ones.
Model shape matters. A star schema lets filters propagate the way the engine expects. Flat wide tables and deep snowflakes both make it work harder.
Cause 2: The DAX
Once the model is sound, DAX is the next candidate. Three patterns cause most of the damage.
Whole tables as filter arguments. Passing an entire table into "CALCULATE" forces a far larger scan than filtering the specific column you actually care about. Microsoft's guidance on this is worth reading in full because the fix is usually a one-line change with a large effect.
Row-by-row iteration where a set operation would do. Iterator functions have their place, but a measure iterating millions of rows to do something the engine could evaluate as a set is a common accident.
The same logic repeated everywhere. When five measures each recompute the same intermediate result, you pay for it five times. Compute once in a variable, or as a base measure the others reference.
Cause 3: The Visuals
Every visual issues at least one query. A page with twenty visuals fires at least twenty queries when it loads, and they compete.
Practical ceilings that hold up in real estates:
- Around eight visuals per page. Pages built to support a decision rarely need more; pages with twenty are usually a dashboard and a report fighting for the same canvas.
- Be wary of custom visuals. Some are excellent, some render poorly at volume. If Performance Analyzer shows high visual-display time, test with a native equivalent.
- Large tables and matrices are expensive. A matrix returning thousands of rows is doing work nobody reads. Aggregate, or paginate.
- Slicers cost more than they look. Each one queries its own distinct values, and a page of slicers over high-cardinality columns is slow before anyone touches anything.
Cause 4: The Source
In Import mode the source only matters at refresh time. In DirectQuery it matters constantly, because every interaction becomes a query against the source - and your report is exactly as fast as that source under concurrency.
If you are on DirectQuery and the source is the bottleneck, the options are: optimise the source, add aggregations so common queries resolve in-memory, switch to Import where freshness allows, or move to Direct Lake in Fabric, which reads Delta tables in OneLake without importing or issuing a query per visual.
What Does Not Fix It
A bigger capacity. Capacity governs concurrency and refresh throughput, not single-query efficiency. A report that is slow for one user at 8am will be equally slow on a larger SKU. Capacity is the right answer for throttling under load - see our sizing guide - and the wrong answer for a badly built model.
Removing data arbitrarily. Cutting history to make things faster trades a performance problem for an analytical one. Fix the model first; you usually find you can keep the history.
Turning off features. Disabling interactions and cross-filtering can mask a slow model while making the report less useful. Occasionally justified, usually avoidance.
A Working Order of Operations
1. Measure with Performance Analyzer. 2. Fix the model - remove columns, reduce cardinality, adopt a star schema. 3. Fix the worst measures, identified by query time rather than by how complex they look. 4. Reduce visuals per page. 5. Reconsider storage mode. 6. Only then consider capacity.
Most estates find that steps two and three alone resolve the complaint.
Where Solv Systems Comes In
Performance work is one of the more satisfying engagements we take, because the gap between a badly modelled estate and a well modelled one is usually dramatic rather than marginal - and it is achieved by removing things rather than buying more.
We diagnose in the order above, fix the Power BI model and the DAX, and leave your team able to spot the same patterns themselves. If your reports are slow enough that people have stopped opening them, that is a design problem with a known fix.
Sources and Further Reading
- Performance Analyzer in Power BI Desktop
- Monitoring report performance
- DAX filter guidance
- DirectQuery in Power BI
Frequently asked
There are only four real candidates: the data model, the DAX, the number and type of visuals, or the source when using DirectQuery. Performance Analyzer in Power BI Desktop tells you which by splitting each visual's time into DAX query, visual display and other. Diagnose before changing anything - most wasted optimisation effort goes into the wrong layer.
Fewer than most reports contain. Every visual issues at least one query, so a page with twenty visuals fires at least twenty queries on load. Eight or so is a reasonable working ceiling for a page that needs to feel fast, and pages built for decisions rarely need more.
Rarely, and it is an expensive way to find out. Capacity helps with concurrency and refresh throughput, not with an inefficient model or badly written DAX. A report that is slow for one user at 8am will still be slow on a larger SKU.
Using entire tables as filter arguments in CALCULATE rather than filtering specific columns, which forces a far larger scan than required. Close behind it are measures that iterate row by row where a set-based expression would do, and complex logic repeated in several measures instead of being computed once.
For query response, usually yes, because the data is already in memory. DirectQuery pushes work to the source on every interaction, so its speed depends entirely on that source. Direct Lake in Fabric changes the trade-off again by reading Delta tables without importing or querying per visual.
A great deal, though column count matters more than row count. Removing unused columns, avoiding high-cardinality text columns and splitting datetime into date and time typically shrink a model substantially, and a smaller model compresses better, refreshes faster and queries faster.