In Short: What Is a Semantic Model?
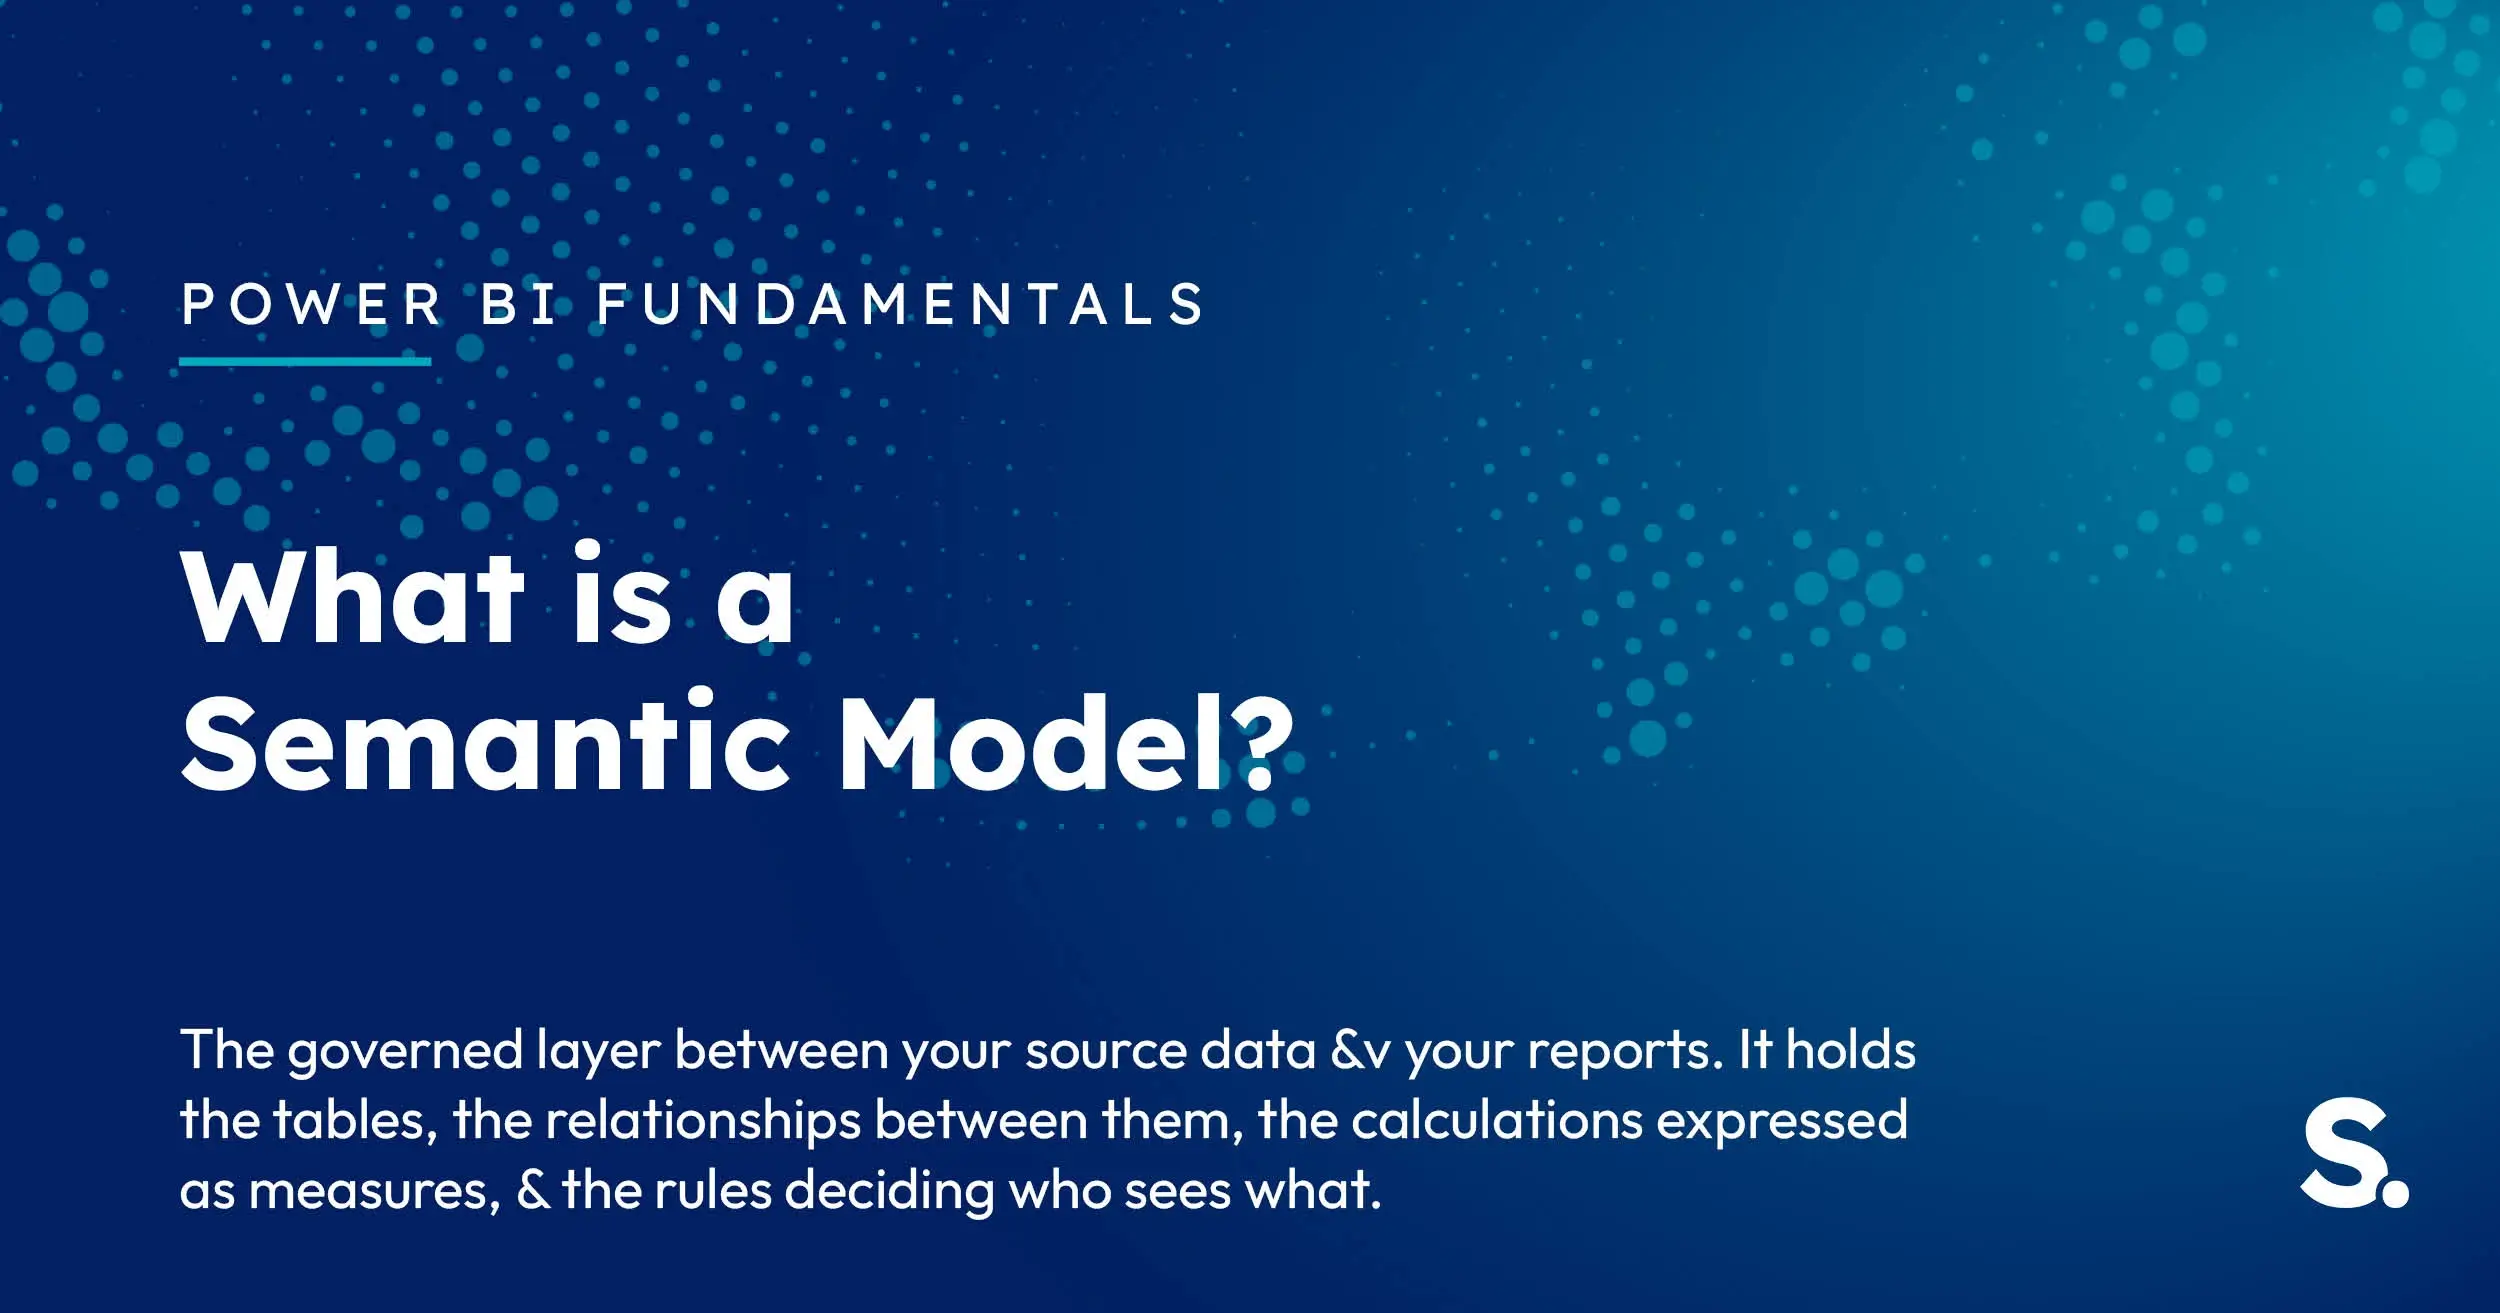
The governed layer between your source data and your reports. It holds the tables, the relationships between them, the calculations expressed as measures, and the rules deciding who sees what. Reports query the model rather than the source - which is why every report built on the same model returns the same numbers. Microsoft renamed "dataset" to "semantic model", and they are the same object.
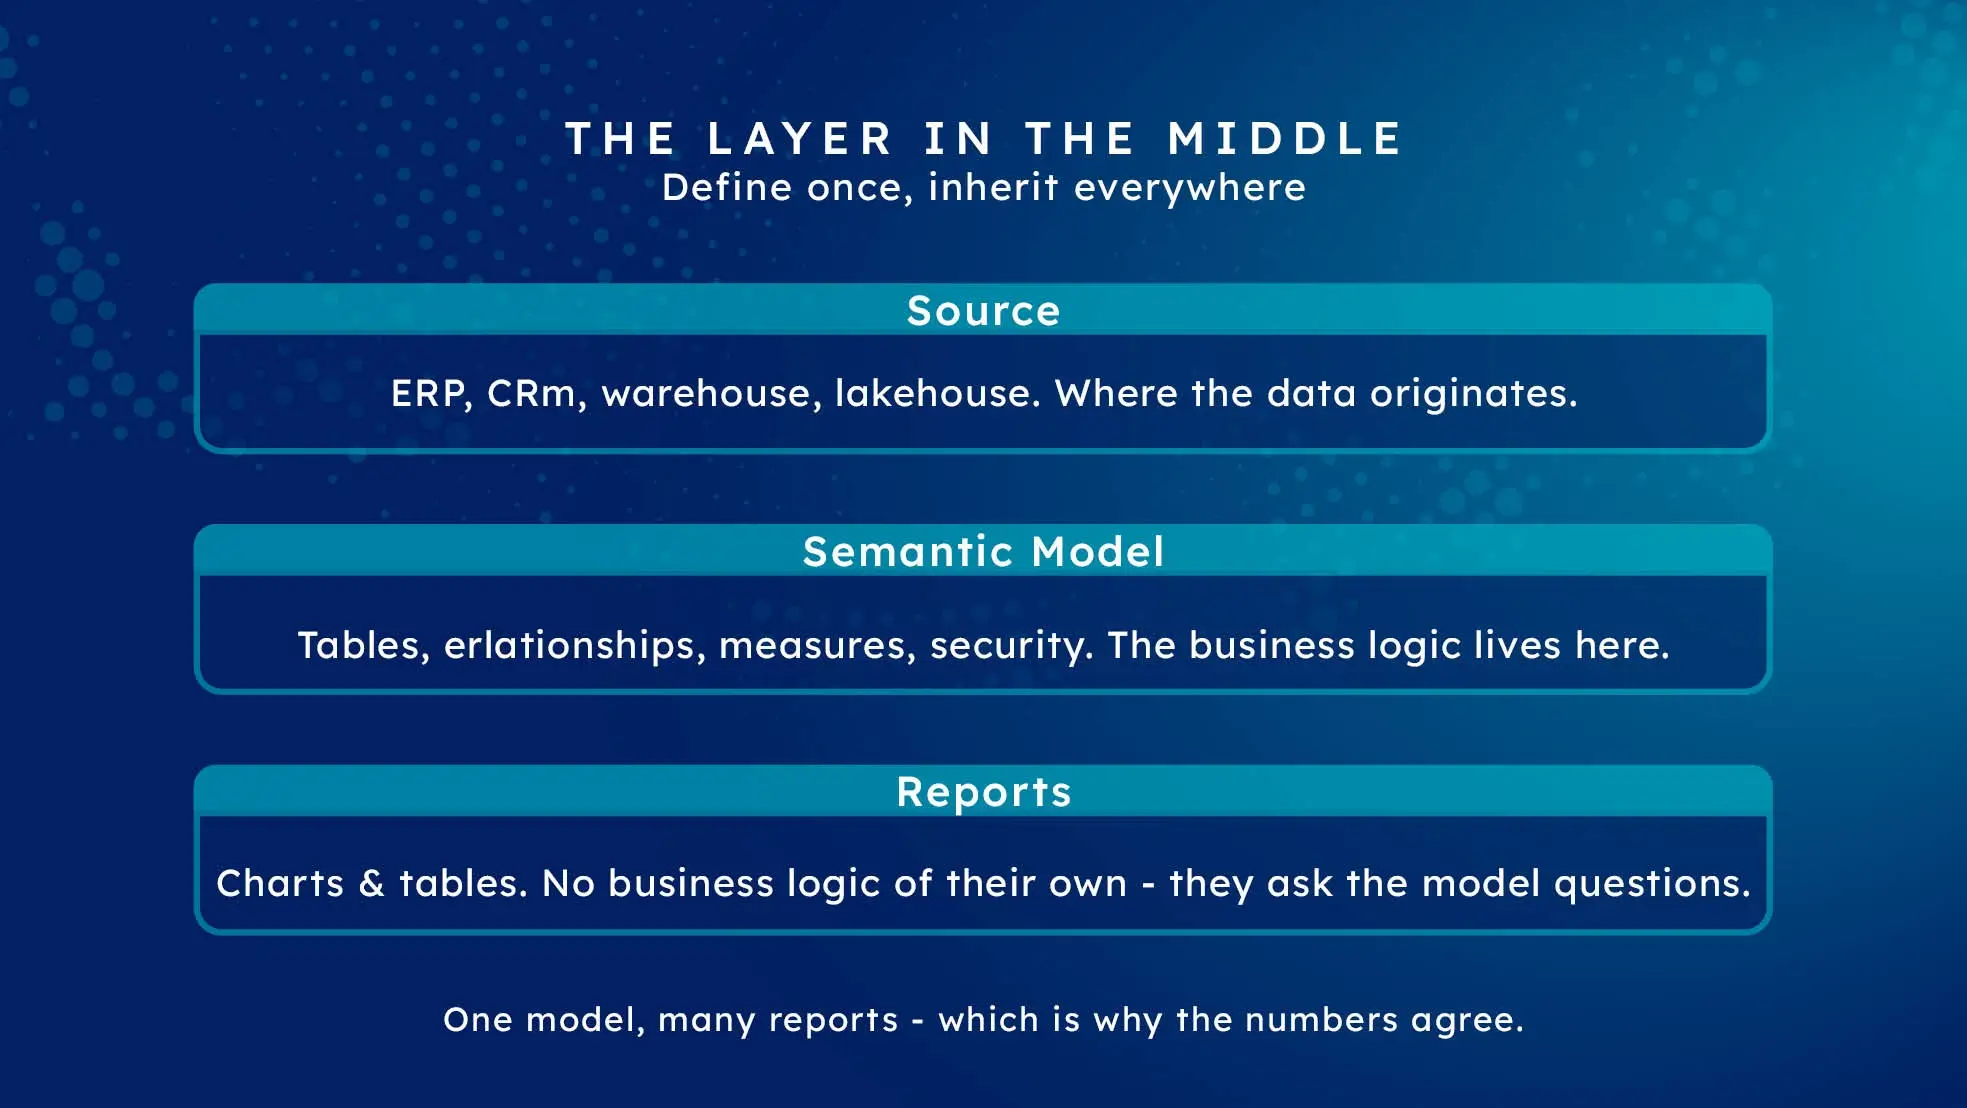
Three Words, Frequently Muddled
Clearing up the vocabulary first, because a surprising amount of confusion traces back to it.
The source is where data originates - your ERP, CRM, warehouse or lakehouse.
The semantic model is the layer in between. Tables, relationships, measures, hierarchies, security. It is what people used to call a dataset.
The report is the visual layer. Charts, tables, filters - the thing users see, which contains no business logic of its own and simply asks the model questions.
The rename from "dataset" to "semantic model" was a clarification rather than a functional change. "Dataset" implied a bag of data; the object is really a model of the business.
Why the Layer Exists
For one report, it does not need to. Connect to a source, build charts, ship. Adding a semantic layer to that is ceremony.
The layer earns its place at the second report, and becomes essential by the fifth. Here is the sequence, which is remarkably consistent:
Report one defines revenue. Report two, built by someone else, defines revenue slightly differently - perhaps it includes credit notes. Report three copies report two. Now three reports disagree, nobody notices for a quarter, and when they do, the discussion is about whose spreadsheet is right rather than what the business should do.
A semantic model prevents that structurally. Revenue is defined once, in one place. Every report inherits it. Change the definition and everything moves together. This is the mechanism behind single-source-of-truth reporting - the phrase describes agreed definitions enforced by a platform, not one big database.
What Lives in a Good One
Tables and relationships. Ideally shaped as a star schema - facts surrounded by dimensions, filters flowing one way. This is the shape Power BI's engine is built for.
Measures. The calculations. Revenue, margin, active customers, on-time percentage. Written once, used everywhere.
A date table. One, marked as such, shared by everything. Not Power BI's automatic hidden date tables, which cannot support consistent time intelligence across facts.
Security. Row-level security applied here rather than in reports, so entitlement is enforced regardless of which report someone opens.
Names people can read. "Total Revenue", not "SUM_AMT_NET_v2". The model is a business artefact, and a business user should be able to browse the field list and recognise their own vocabulary.
Measures Versus Calculated Columns
The distinction that trips up most people moving from Excel.
A calculated column is computed once per row when the model refreshes, and stored in memory. It behaves like a spreadsheet column.
A measure is computed at query time, based on whatever filters currently apply. Filter to one region and it recalculates for that region.
Measures are usually right. They stay flexible, they do not inflate the model, and they respond to context the way users expect. Calculated columns make sense when you need a value to group or filter by that the source does not provide - a band, a category, a flag.
Reaching for calculated columns by default is the clearest sign of someone thinking in spreadsheets, and it produces models that are both larger and less useful than they should be.
One Model, Many Reports
This is the pattern that separates estates that scale from those that sprawl.
A shared semantic model, certified so people can see it is the approved source, with many reports built on top. Definitional changes happen once. New reports start from agreed logic. Analysts build on a foundation rather than starting from raw data every time.
The alternative - a model per report - is how organisations end up with forty datasets, thirty of which are near-duplicates, and nobody able to say which is right. See workspace governance for the structure that keeps this under control.
Where the Model Should Sit
In a Fabric estate, a useful division of labour:
Heavy transformation belongs upstream - in the lakehouse, in pipelines, in the Silver and Gold layers. Done once, reusable, testable.
The semantic model holds business meaning - relationships, measures, hierarchies, security. Light on transformation, rich in definition.
When substantial transformation logic ends up in Power Query inside the model, it becomes invisible to everything else, runs on every refresh, and cannot be reused. That is the most common structural mistake we see in otherwise well-built estates.
Where Solv Systems Comes In
Nobody calls asking for a semantic model. They call because reports are slow, or the numbers disagree, or the estate has become unmanageable - and the answer is very often the model underneath.
We design models that stay fast and legible as they grow, retrofit existing ones incrementally without taking reporting offline, and name things so the people who use them can understand what they mean. It is the least visible part of a Power BI engagement and reliably the highest-leverage. Semantic models are a large share of the DP-600 exam - see our DP-600 study guide.
Sources and Further Reading
- Endorsing and certifying Power BI content
- Star schema guidance for Power BI
- Model relationships in Power BI
- Row-level security in Power BI
Frequently asked
The governed layer between your source data and your reports. It holds the tables, the relationships between them, the calculations expressed as measures, and the security rules that decide who sees what. Reports query the semantic model rather than the source, which is why every report built on it returns consistent numbers.
Effectively yes - Microsoft renamed datasets to semantic models to describe more accurately what they are. If you see both terms in documentation or in the interface, they refer to the same object. The rename was a clarification rather than a change in behaviour.
You can, and for one report it is simpler. It stops working when you have several, because each report then defines its own version of every calculation. The semantic model exists so that 'revenue' is defined once and inherited everywhere, which is the difference between consistent reporting and an argument.
A clear grain, a star schema shape, measures rather than calculated columns where possible, one shared date table, descriptive names a business user can read, and security applied at the data layer. Good models are legible - someone who did not build it can understand what it means.
Yes, and they should. A shared, certified model is the mechanism that keeps numbers consistent across an organisation, and it means a definitional change is made once rather than in every report that happens to use it.
A calculated column is computed once per row when the model refreshes and stored in memory. A measure is computed at query time based on whatever filters apply. Measures are usually the right choice - they stay flexible and they do not inflate the model.