In Short: Why Does Every Department Report a Different Number?
Because your organisation has no single, agreed definition of its own metrics. Different departments use different definitions, pull from different systems, and refresh at different times - so finance, sales, and operations each produce an honestly-calculated number that contradicts the others. The fix is architectural, not behavioural: define every KPI exactly once in a governed Power BI semantic model, certify it, and make every report draw from that one place.
The Meeting That Starts With an Argument
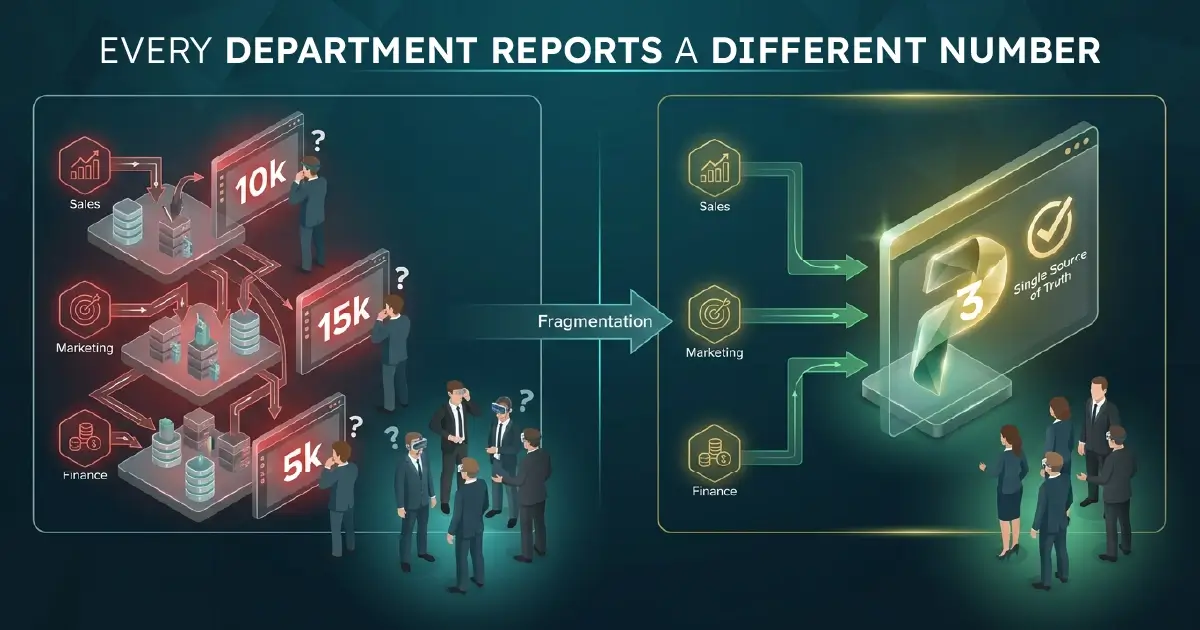
The monthly executive meeting starts the same way it always does. Finance presents revenue at one figure. Sales presents it at another. Operations has a third number that doesn't match either. The first twenty minutes of the meeting - the time that should be spent deciding what to do - are spent arguing about whose number is right.
If that scene feels familiar, you're not alone. It is the single most common problem we encounter when we start working with a new client, and it is almost never caused by anyone doing anything wrong. It is caused by something structural: your organisation has no single, agreed definition of its own metrics.
Why the Numbers Never Match
When different departments report different figures for what sounds like the same KPI, one of three things is usually happening.
Different definitions. "Revenue" sounds unambiguous until you ask whether it includes credit notes, intercompany transactions, or orders that have been invoiced but not yet shipped. Finance may recognise revenue at invoice date; sales may count it at order date. Both numbers are correct by their own definition. Neither definition has ever been written down, agreed, or enforced.
Different data sources. Sales pulls from the CRM. Finance pulls from the ERP. Operations exports from a warehouse system into a spreadsheet. Each system holds a partial, slightly different version of the truth, and each department trusts the version it can see.
Different timing. One report was refreshed this morning. Another was built from last Friday's export. A third is a spreadsheet someone updated manually three weeks ago. Even with identical definitions and sources, the numbers will drift apart.
Individually, each of these seems small. Together, they compound into something expensive: an organisation where every decision starts with a debate about the data instead of a discussion about the business.
The Real Cost of Conflicting Numbers
The obvious cost is wasted time - the reconciliation exercises, the "can you check this figure" emails, the meetings that stall. But the deeper cost is trust.
Once leaders learn that the numbers can't be relied on, they stop relying on them. Decisions revert to instinct and seniority. The analysts who produce the reports spend their time defending figures instead of finding insight. And when a genuinely alarming number appears - a margin collapse, a churn spike - it gets the same sceptical shrug as everything else. An organisation that cannot trust its own reporting is effectively flying on instruments it doesn't believe.
There's a compliance dimension too. If your board pack, your investor reporting, and your management accounts are assembled from different sources with different logic, you carry real risk every time those documents are compared.
What Good Looks Like: One Definition, Defined Once
The fix is not another reconciliation project, and it is not asking everyone to "be more careful." The fix is architectural: metrics need to be defined once, in one governed place, and every report needs to draw from that place.
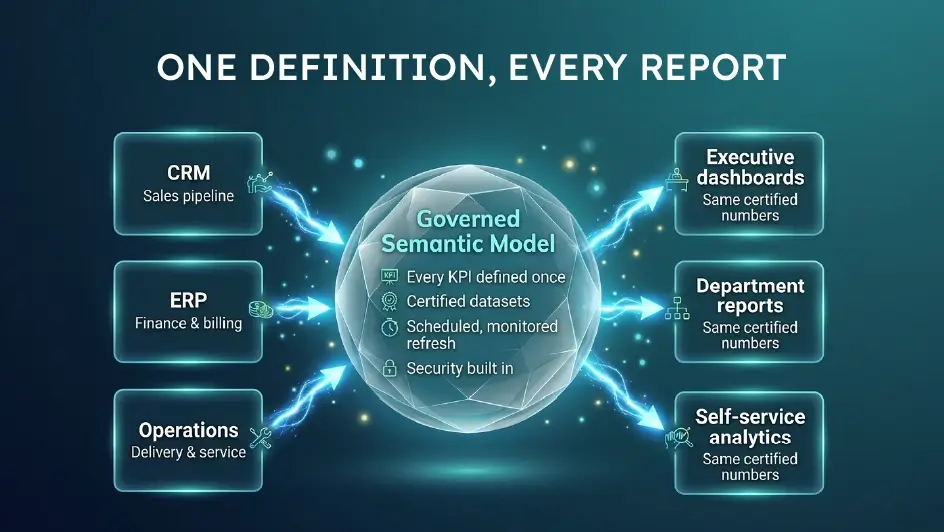
In the Microsoft ecosystem, that place is a Power BI semantic model - a governed layer that sits between your source systems and every dashboard, report, and export your organisation produces. Inside the semantic model:
- Every KPI is defined exactly once. "Revenue," "active customer," "gross margin" - each has a single, agreed calculation, written in one place. Change the definition and every report updates together.
- Data is integrated before it is reported. Pipelines consolidate your CRM, ERP, and operational systems into one trusted foundation, so departments stop reporting from partial views.
- Datasets are certified. Power BI lets you mark datasets as certified, so anyone building a report can immediately see which source is the endorsed one - and self-service users build on trusted foundations instead of creating new versions of the truth.
- Refresh is scheduled and monitored. Everyone looks at data from the same point in time, refreshed automatically, not from whichever export happened to be lying around.
This is what people mean by a "single source of truth," but the phrase undersells it. It isn't one big database; it's one agreed set of definitions, enforced by the platform rather than by good intentions.
How to Get There
1. Start with the metrics that cause the arguments. You don't need to model the whole business on day one. Pick the five to ten KPIs that appear in the executive pack, and get every stakeholder in a room to agree - formally - what each one means. This conversation is uncomfortable precisely because it has never happened. It is also where most of the value is created.
2. Build the integration underneath them. Connect the systems those KPIs actually depend on and consolidate them into a governed model. This is where experienced hands matter: the difference between a semantic model that performs and one that collapses under real-world data volumes is design, not tooling. (Not sure you need a platform underneath at all? Here is the honest test.)
3. Rebuild the executive reporting on top. One certified dataset, one set of dashboards, refreshed automatically. Retire the competing spreadsheets deliberately - if the old versions stay alive, the old arguments stay alive with them. (If the pack itself takes days to assemble each month, that is a solvable problem too.)
4. Expand outwards. Once leadership trusts the numbers, extend the same model to departmental and operational reporting, so the whole organisation inherits the same definitions - with row-level security controlling who sees what.
Where Solv Systems Comes In
This is the work we do every week. Solv Systems is a Microsoft Partner specialising in Power BI, Microsoft Fabric, and data platform consulting, with more than 100 projects delivered across the US, UK, Europe, and beyond.
Our approach to the "conflicting numbers" problem is deliberately business-first. We start by facilitating the definitions conversation with your stakeholders - not with technology. Then we build the governed semantic model and the data integration underneath it, publish certified datasets, and rebuild your critical reporting so that every dashboard draws from the same certified source. Governance, security, and row-level access controls are built in from the start, so trusted data stays trusted as more people use it.
Clients consistently tell us the same thing afterwards: the technology mattered, but the transformation was cultural. Meetings changed. The debate moved from "whose number is right?" to "what should we do about it?" - which is the entire point of having data in the first place.
Stop Debating the Numbers
If your leadership meetings still start with reconciliation, that is not a fact of life - it is a solvable, well-understood problem with a proven fix.
Our Power BI consulting team facilitates the definitions work, builds the governed semantic model, and rebuilds the critical reporting on top - so the debate moves from whose number is right to what to do about it.
Sources and Further Reading
Frequently asked
Three causes, usually combined: different definitions (finance and sales count 'revenue' differently), different data sources (CRM versus ERP versus spreadsheets), and different timing (reports refreshed on different schedules). Each department's number is correct by its own rules - the organisation has just never agreed one set of rules.
One governed set of metric definitions that every report draws from - not one big database. In Power BI this takes the form of a certified semantic model: each KPI is calculated once, in one place, and every dashboard inherits the same definition.
A governed data layer that sits between your source systems and your reports. It holds the integrated data, the relationships between entities, and the KPI calculations - so every report consumes agreed numbers rather than recalculating its own version.
Certification is Power BI's endorsement mechanism. A certified dataset is marked as the organisation's approved source, so anyone building a report can see instantly which foundation to build on - instead of creating another competing copy of the truth.
The first pass typically takes weeks, not months: agree formal definitions for the five to ten KPIs in the executive pack, build the governed model underneath them, and rebuild the executive reporting on top. The model then extends outwards department by department.
No. Your operational systems stay exactly as they are. The semantic model integrates their data downstream and enforces the definitions in the reporting layer - consistency comes from governance, not from changing the systems themselves.