In Short: What Is a Star Schema and Why Does Power BI Want One?
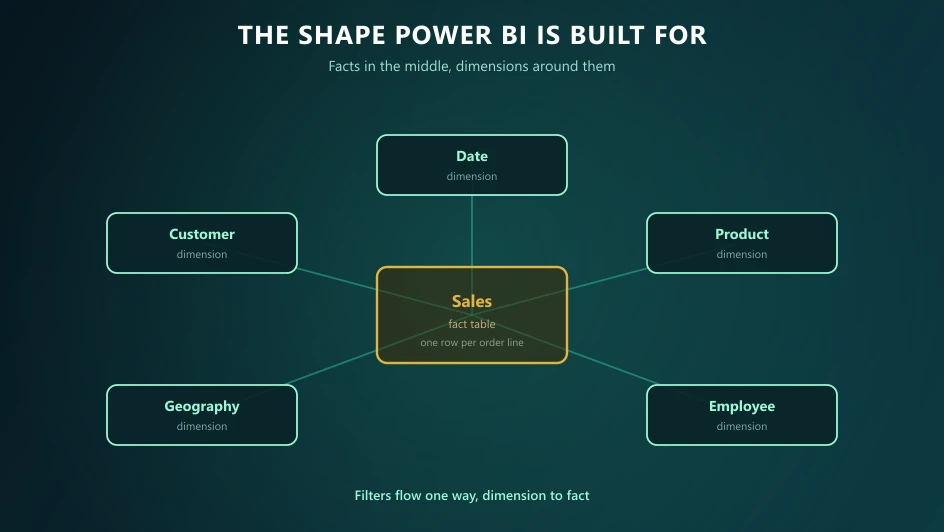
A star schema puts measurable events in fact tables and descriptive attributes in dimension tables, with relationships running one way from dimension to fact. Power BI's engine is built for exactly this shape: filters propagate predictably, compression works well, and DAX behaves as documented. Flat wide tables and deep snowflakes both fight the engine. It is the highest-leverage single decision in a Power BI estate.
Why Flat Tables Stop Working
Most Power BI estates begin with one wide table, and for a first report that is genuinely the right call. The trouble arrives predictably.
The second fact table. You add budget alongside actuals, or web sessions alongside orders. Now two tables need filtering by the same date and the same product, and with no shared dimensions there is nothing to filter them consistently. Every measure becomes a special case.
Compression degrades. Flat tables repeat descriptive text on every row - customer name, product name, region - millions of times. Dimensions store each value once, which is why the same data models smaller in a star.
Ambiguity creeps in. Without a single source for "customer", different reports resolve the same question differently, and you are back to conflicting numbers with a data model to blame rather than a spreadsheet.
The Shape
Fact tables hold events, at a defined grain - one row per order line, one row per transaction, one row per day per product. They contain the numeric measures and the keys that link out to dimensions. They are usually long and narrow.
Dimension tables hold the things you filter and group by: date, customer, product, employee, location. They are usually short and wide, and they carry the descriptive text.
Relationships run one-to-many from dimension to fact, filtering in a single direction. Microsoft's star schema guidance sets out the canonical version, and their relationships documentation covers the mechanics.
Decisions That Matter More Than They Look
Grain, decided first
The grain is what one row of a fact table represents, and every later decision depends on it. Order header or order line? Daily snapshot or transaction? Getting this wrong is the one modelling error that genuinely requires a rebuild rather than a refactor, so write it down explicitly before building anything.
A real date dimension
Power BI will generate hidden date tables per date column if you let it. That inflates the model and makes consistent time intelligence across multiple facts impossible.
Build one date table, mark it as the date table, and share it. Include the columns your business actually uses - fiscal periods, week numbers, working-day flags - because putting them in the dimension is far cheaper than computing them in DAX repeatedly.
Flatten your snowflakes
Product to subcategory to category as three tables is technically tidier and practically worse: more relationships to traverse, more joins per query, and a model users find harder to read. Collapse it into one product dimension unless a specific requirement demands otherwise.
Bidirectional filtering, sparingly
It solves a real problem occasionally and creates ambiguity often. Reach for it only when you can state precisely why, and be aware it can make performance unpredictable in ways that are hard to trace later.
Handling Change Over Time
Attributes move. A customer changes region, a product changes category. Two choices, and picking deliberately matters:
- Overwrite - the dimension always shows current values, and history is restated. Simple, and usually right for attributes where nobody asks "what was it then?"
- Track history - add validity dates and keep old rows, so a transaction stays attached to the region it was in at the time. More work, and necessary the moment someone reports on a restructure.
The failure mode is not choosing - overwriting by default and then being asked, a year later, for a comparison that the model can no longer produce.
Where the Modelling Should Live
In a Fabric estate, the conforming work belongs in the Silver and Gold layers of the lakehouse, not in Power Query. Reasons: it happens once rather than per dataset, it is testable, it is reusable across models, and it does not consume refresh time.
Power Query is for the last mile. When substantial business logic lives in it, that logic is invisible to everything except the one dataset containing it.
Retrofitting an Existing Model
Nobody gets to start clean. The workable path is incremental:
1. Extract the date dimension first - highest benefit, lowest risk, and it usually shrinks the model immediately. 2. Extract the dimension causing the most trouble, typically customer or product. 3. Repoint measures and validate against the existing report, number by number. 4. Repeat.
Run the old and new models side by side until the numbers reconcile. A single-shot remodel of a live estate is how these projects acquire a bad reputation.
Where Solv Systems Comes In
Semantic modelling is where Power BI engagements quietly succeed or fail, and it is the part clients are least likely to ask for by name - they ask for reports, or for better performance, and the answer is usually the model underneath.
We design models that stay fast and legible as they grow, retrofit existing ones incrementally without taking reporting offline, and explain the reasoning as we go so your team can extend the model rather than work around it.
Sources and Further Reading
- Star schema guidance for Power BI
- Model relationships in Power BI
- Fabric lakehouse and medallion architecture tutorial
Frequently asked
A data model with one or more fact tables holding measurable events - sales, transactions, orders - surrounded by dimension tables holding the descriptive attributes you filter and group by, such as date, customer, product and geography. Relationships run one way, from dimension to fact.
Because its engine is built for it. Filters propagate predictably from dimensions to facts, compression works well on the repeated values dimensions produce, and DAX behaves the way the documentation describes. Flat and snowflaked models both fight the engine to some degree.
For a small dataset with one subject area, yes, and it is often the right pragmatic answer. It stops working when you add a second fact table, need to filter several facts consistently, or grow large enough that repeated text values inflate the model. Most estates hit at least one of those within a year.
A snowflake normalises dimensions into further related tables - product to subcategory to category as three tables rather than one. It saves a little space and costs query performance and clarity. In Power BI the usual advice is to flatten snowflakes into single dimension tables unless there is a specific reason not to.
Yes, in practically every model. Power BI's automatic date handling creates hidden tables per date column, which bloats the model and cannot support consistent time intelligence across facts. One marked date table shared by everything is both smaller and more capable.
Incrementally rather than as a rebuild. Extract the highest-value dimension first - usually date, then customer or product - point the measures at it, and validate. Doing this while the report stays live is normal; attempting a single-shot remodel of a working estate rarely goes well.