In Short: Why Does the Monthly Report Take Days?
Because people are doing work that pipelines should do. When data lives in disconnected systems, someone has to export, paste, reconcile, and format it every month - and the report moves at the speed of that person. Automated Power BI reporting replaces the assembly line: integration pipelines consolidate your systems into a governed dataset on a schedule, dashboards draw from it directly, and month-end becomes a review instead of a construction project.
The Ritual Nobody Questions
Somewhere in your organisation, right now, a capable and probably expensive person is copying numbers from one spreadsheet into another.
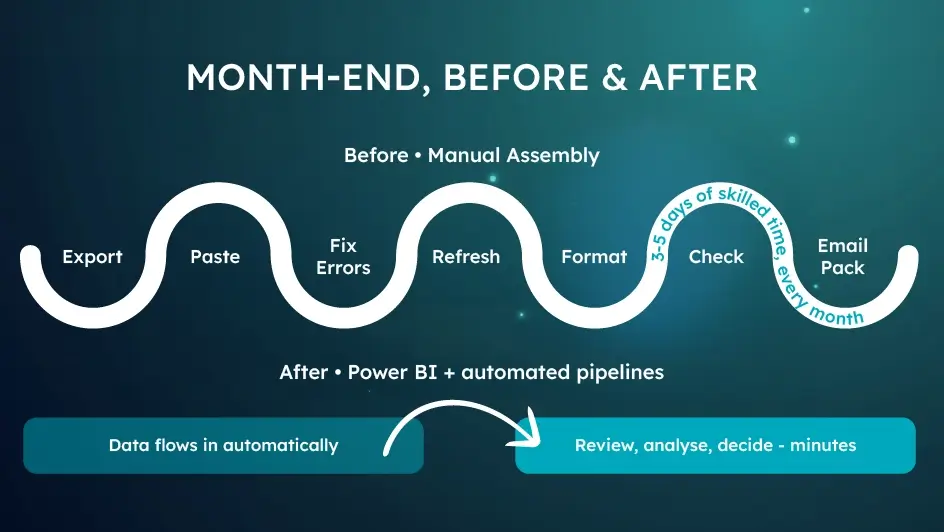
It's month-end, or close to it. The routine is familiar: export data from the ERP, export more from the CRM, download the operations numbers, paste everything into the master workbook, fix the rows that broke, refresh the pivot tables, update the charts, check the totals against last month, paste the charts into PowerPoint, and email the pack to leadership. Three days later - five if something went wrong - the monthly report ships.
Then next month, the whole thing happens again.
The Hidden Invoice You Pay Every Month
Manual reporting feels free because no one ever sees an invoice for it. But the costs are real, and they compound.
You're paying analyst salaries for clerical work. The people who build these reports were hired for their judgement - to spot trends, question anomalies, and advise the business. Instead, the majority of their reporting time goes into data assembly. By the time the numbers are compiled, there's no time left to think about what they mean.
Errors are inevitable, and they surface at the worst moments. Every manual step - every export, paste, and formula drag - is a chance for a silent mistake. A row lost here, a stale tab there. Most errors are harmless. The one that isn't will surface in a board meeting, and it will cost you far more than embarrassment: it costs the report its credibility.
The process is a single point of failure. In many organisations, exactly one person knows how the master workbook actually works. When they're on leave, reporting slips. When they resign, the process leaves with them.
Decisions wait for the data. If the report takes a week to assemble, leadership is always reacting to information that is at least a week old - and often a month. In a fast-moving business, that lag has a price of its own.
Add it up honestly - hours, error risk, key-person dependency, decision lag - and manual reporting is one of the most expensive "free" processes in your business.
Why This Problem Persists
Most teams know their reporting process is painful. It survives anyway, for understandable reasons: the process works, more or less; the people running it are too busy running it to redesign it; and previous automation attempts often stalled because they tried to automate the spreadsheet instead of replacing the architecture that made the spreadsheet necessary.
That last point matters. The spreadsheet is not the problem. The spreadsheet is a symptom of data that lives in disconnected systems with no integrated layer on top. Automate the copying and pasting and you've built a faster version of a fragile process. Fix the data foundation and the reporting becomes a by-product.
What Good Looks Like: Reporting as a By-Product
With a properly built Power BI reporting solution, the monthly grind disappears because the assembly work is done by pipelines, not people.
- Data flows in automatically. Integration pipelines connect your ERP, CRM, and operational systems and consolidate them into a trusted, governed dataset - refreshed on schedule, not on someone's calendar.
- The report builds itself. Dashboards and paginated reports draw from that dataset directly. Month-end reporting stops being a construction project and becomes a review: the numbers are already there.
- One version, always current. Leadership looks at the same live dashboards the analysts do. The "which version of the pack is this?" email thread disappears - and because everything draws from one certified source, the numbers agree with each other too.
- Distribution is automated too. Scheduled subscriptions deliver the right view to the right people - with row-level security ensuring each audience sees only what they should.
The three days your analysts spent assembling data become three days spent analysing it. That's not a productivity tweak; it's a different job description.
How to Get There
1. Map the current process honestly. List every report produced each month, every source it draws from, and every manual step in between. Most organisations are startled by the total.
2. Prioritise by pain. The executive monthly pack is usually the right first target: high visibility, high effort, and a clear before-and-after. For finance teams specifically, our Excel to Power BI guide covers what to move and what to leave in Excel.
3. Build the integrated foundation. Connect the source systems and consolidate them into a governed Power BI dataset. This step determines whether the automation holds up - refresh reliability, performance, and data quality all live here.
4. Rebuild the reports on top, then retire the old process. Run parallel for one cycle to build confidence, then switch off the manual workbook deliberately. If it stays alive "just in case," it will quietly become the process again.
Where Solv Systems Comes In
Automating reporting is one of the most common engagements Solv Systems delivers - and one of the fastest to pay for itself. As a Microsoft Partner with 100+ projects delivered globally, we've replaced manual reporting processes in businesses from 50-person operations to enterprise groups.
Our delivery is iterative and outcome-first. We start with the report that hurts most, build the data integration and governed dataset underneath it, and ship working dashboards in stages - so you see value in weeks, not at the end of a long programme. Clients tell us the effect is immediate: as one G2 reviewer put it, what stands out is our ability "to understand the business context and translate complex data into clear, usable insights."
And because we build with skills transfer in mind, your team ends the engagement able to maintain and extend the solution - not dependent on us for every change.
Get Your Month Back
If your team loses days to report assembly every month, that time is recoverable - usually faster than you'd expect.
Our Power BI consulting team will walk through your current reporting process, identify what can be automated first, and give you a straight answer on effort and payoff.
Sources and Further Reading
Frequently asked
Most organisations recover several analyst-days per month per major report. The monthly pack that took three to five days of exports, pasting, and formatting becomes a review of dashboards that are already current - and the recovered time goes into analysis, which is what the analysts were hired for.
Integration pipelines that pull from your ERP, CRM, and operational systems on schedule; a governed, certified dataset where the numbers are consolidated; dashboards and paginated reports drawing from it directly; and automated distribution through subscriptions with row-level security controlling who sees what.
The most common mistake is automating the spreadsheet instead of replacing the architecture that made the spreadsheet necessary. The spreadsheet is a symptom of disconnected systems with no integrated data layer. Automate the copy-paste and you get a faster fragile process; fix the foundation and reporting becomes a by-product.
Yes. Paginated reports and scheduled subscriptions can deliver a polished pack automatically - but most leadership teams shift to the live dashboards within a few cycles once they trust that the numbers are always current and always consistent.
Messy data is an argument for automation, not against it. Much of the mess lives in the manual steps themselves - improvised exports, hand-fixed rows, stale tabs. Pipelines with quality rules applied on every refresh fix the data at its source, once, instead of by hand, monthly.
The first automated report typically ships in weeks: connect the sources it depends on, build the governed dataset, rebuild the report on top, and run one cycle in parallel with the old process to build confidence before retiring the workbook deliberately.