In Short: What Is Microsoft Power BI?
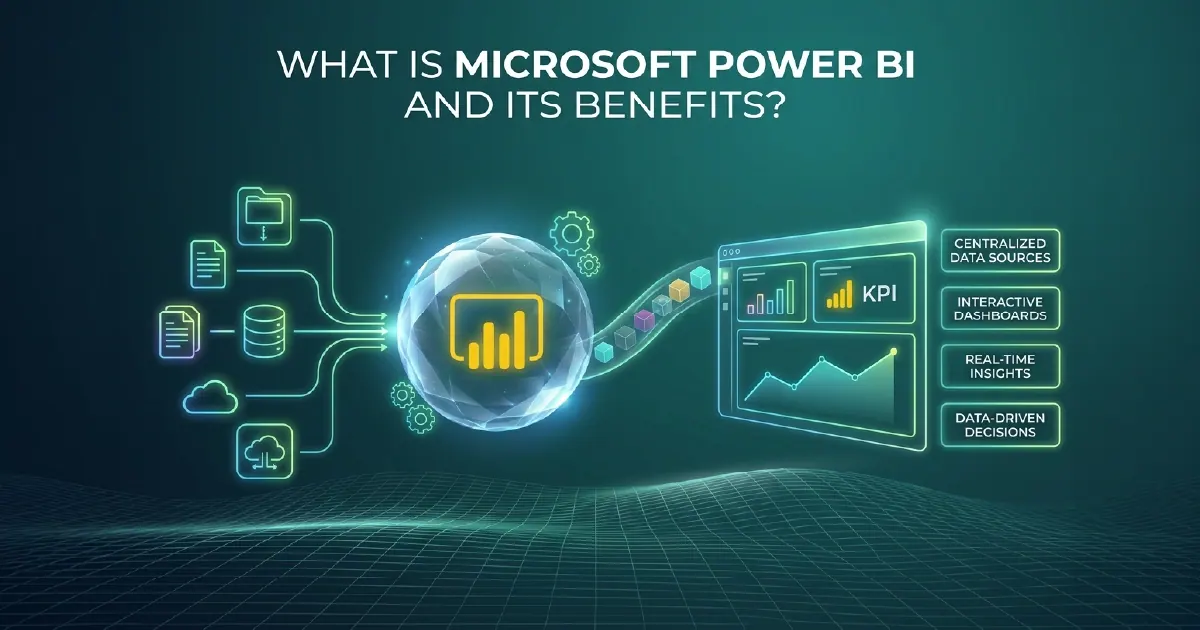
Microsoft Power BI is a business intelligence and data visualisation platform that connects to data sources, transforms and models data, and produces interactive reports and dashboards that business users can explore, share, and act on. It is the world's most widely used BI platform and forms the reporting and visualisation layer of Microsoft Fabric.
If your organisation currently makes decisions based on spreadsheets, static reports, or data that lives in disconnected systems, Power BI is the platform Microsoft has built to change that.
The Three Components of Power BI
Power BI Desktop
Power BI Desktop is the Windows application where data professionals build data models and reports. It connects to hundreds of data sources - databases, cloud services, flat files, APIs - transforms data using Power Query (M language), defines business logic using DAX (Data Analysis Expressions), and produces .pbix files that can be published to the Power BI service.
Most Power BI development work happens in Desktop. If your organisation has a BI developer or data analyst, they are likely spending significant time here building semantic models and report layouts.
Power BI Service
The Power BI service (app.powerbi.com) is the cloud-hosted platform where reports and dashboards are published, shared, and governed. It handles user access, scheduled data refresh, row-level security, workspace management, and the API layer that connects Power BI to other Microsoft services including Teams, SharePoint, and Microsoft Fabric.
Business users interact with Power BI primarily through the service - viewing reports, exploring data through Q&A natural language querying, and (with Fabric IQ) asking questions through Microsoft 365 Copilot in Teams and Outlook.
Power BI Mobile
Power BI Mobile apps for iOS, Android, and Windows provide optimised report access on mobile devices. For operations, sales, and field teams that need KPIs and operational dashboards on the move, Power BI Mobile provides offline access to key reports and push notifications for KPI threshold breaches.
What Power BI Enables for Your Organisation
Self-Service Analytics
Power BI democratises data access. Business users who previously depended on IT or BI teams to generate reports can build their own data views within the governance guardrails that IT defines. Dataflows handle transformation once centrally; semantic models define business logic; users explore within those governed bounds.
The result is faster access to accurate information across the organisation, with fewer dependencies on BI developers for routine data questions.
Governed Data Sharing
Workspaces, apps, and row-level security allow BI teams to share data-backed reports with precise control over who sees what. A single semantic model can serve a CFO dashboard showing company-wide financials and a regional manager view showing only their territory - governed from one central definition, not from two separately maintained reports.
Real-Time Operational Dashboards
Power BI supports scheduled refresh (data updates on a defined interval) and real-time streaming datasets for dashboards that need live operational data. For manufacturing, logistics, and financial services use cases where dashboards must reflect current operations rather than yesterday's state, Power BI provides the streaming infrastructure to do this within the same platform as your standard reporting.
Power BI and Microsoft Fabric
Power BI is natively embedded in Microsoft Fabric as one of its six workloads. For organisations with Fabric capacity, this integration delivers two significant capabilities:
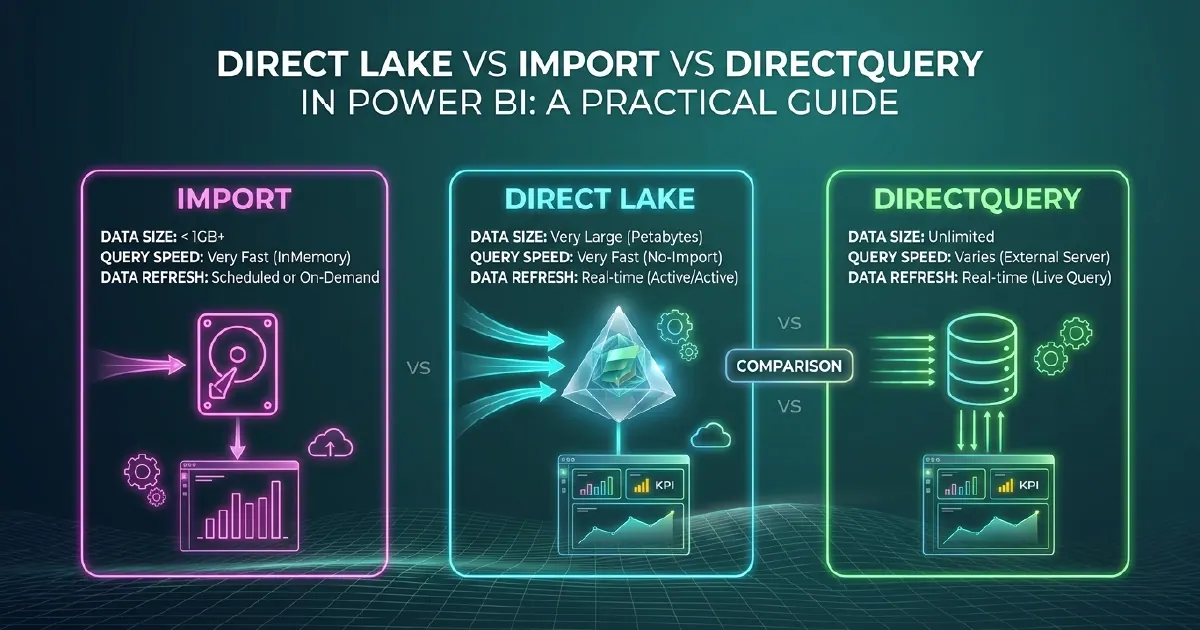
Direct Lake mode allows Power BI semantic models to query Gold-layer OneLake tables at high speed without importing data or using standard DirectQuery. For datasets where Import mode is impractical (too large or too frequently updated) and DirectQuery is too slow for acceptable report performance, Direct Lake delivers Import-level speed with DirectQuery-level freshness.
Unified governance means that semantic models in Fabric are governed by Microsoft Purview alongside every other Fabric asset. Lineage tracking, sensitivity labels, and access controls apply consistently across the entire data estate - reports, datasets, pipelines, and Lakehouse tables.
Power BI Licensing
Power BI has three primary licence options:
- Power BI Pro ($10/user/month): For sharing and collaboration on standard reports and dashboards. Required for publishing content and for consumers accessing content from Pro-licensed workspaces.
- Power BI Premium Per User ($20/user/month): Adds paginated reports, advanced AI features, larger dataset size limits, and XMLA endpoint access for external tools. For organisations with advanced requirements that do not yet need full Fabric capacity.
- Microsoft Fabric Capacity (F-SKU): Includes Power BI Premium capacity alongside all other Fabric workloads. Best for organisations with significant data volumes, data engineering requirements, or that want Direct Lake and Fabric IQ capabilities.
The Practical Benefits of Power BI
The most consistent benefit organisations report from Power BI implementations is decision speed - the time between data changing and decisions reflecting that change compresses from days or weeks to hours. For sales performance management, operational efficiency tracking, and financial management, this acceleration in the feedback loop has direct business value.
The second consistent benefit is reduction in spreadsheet proliferation - the shadow data landscape of Excel files, personal Access databases, and manually maintained reports that parallel the official BI estate. Power BI governed semantic models give users the self-service flexibility they previously sought through spreadsheets, within a governed, auditable environment.
The third benefit, increasingly relevant in 2026, is AI readiness. Well-structured Power BI semantic models are the foundation for Fabric IQ, Rayfin natural language querying, and Fabric Data Agents. An organisation with a mature Power BI estate is positioned to activate Microsoft's AI capabilities without rebuilding its data layer first.
Our Power BI and analytics consulting team works with organisations across the UK, US, and South Africa to design and build Power BI implementations that deliver these benefits from the outset.