In Short: How Do You Migrate Tableau to Power BI?
By rebuilding, not converting. No automated path produces production-quality output, because the two products model data and express calculations differently. Plan a rebuild on a shared semantic model, triage by usage first because a large share of any Tableau estate is unused, and run both platforms in parallel per dashboard until the numbers reconcile.
Start by Deciding What Not to Migrate
The cheapest work in any migration is the work you do not do.
Pull usage statistics from Tableau Server or Cloud before scoping anything. Most estates find a substantial proportion of dashboards have not been opened in months - built for a project, a person who has left, or a question nobody asks any more.
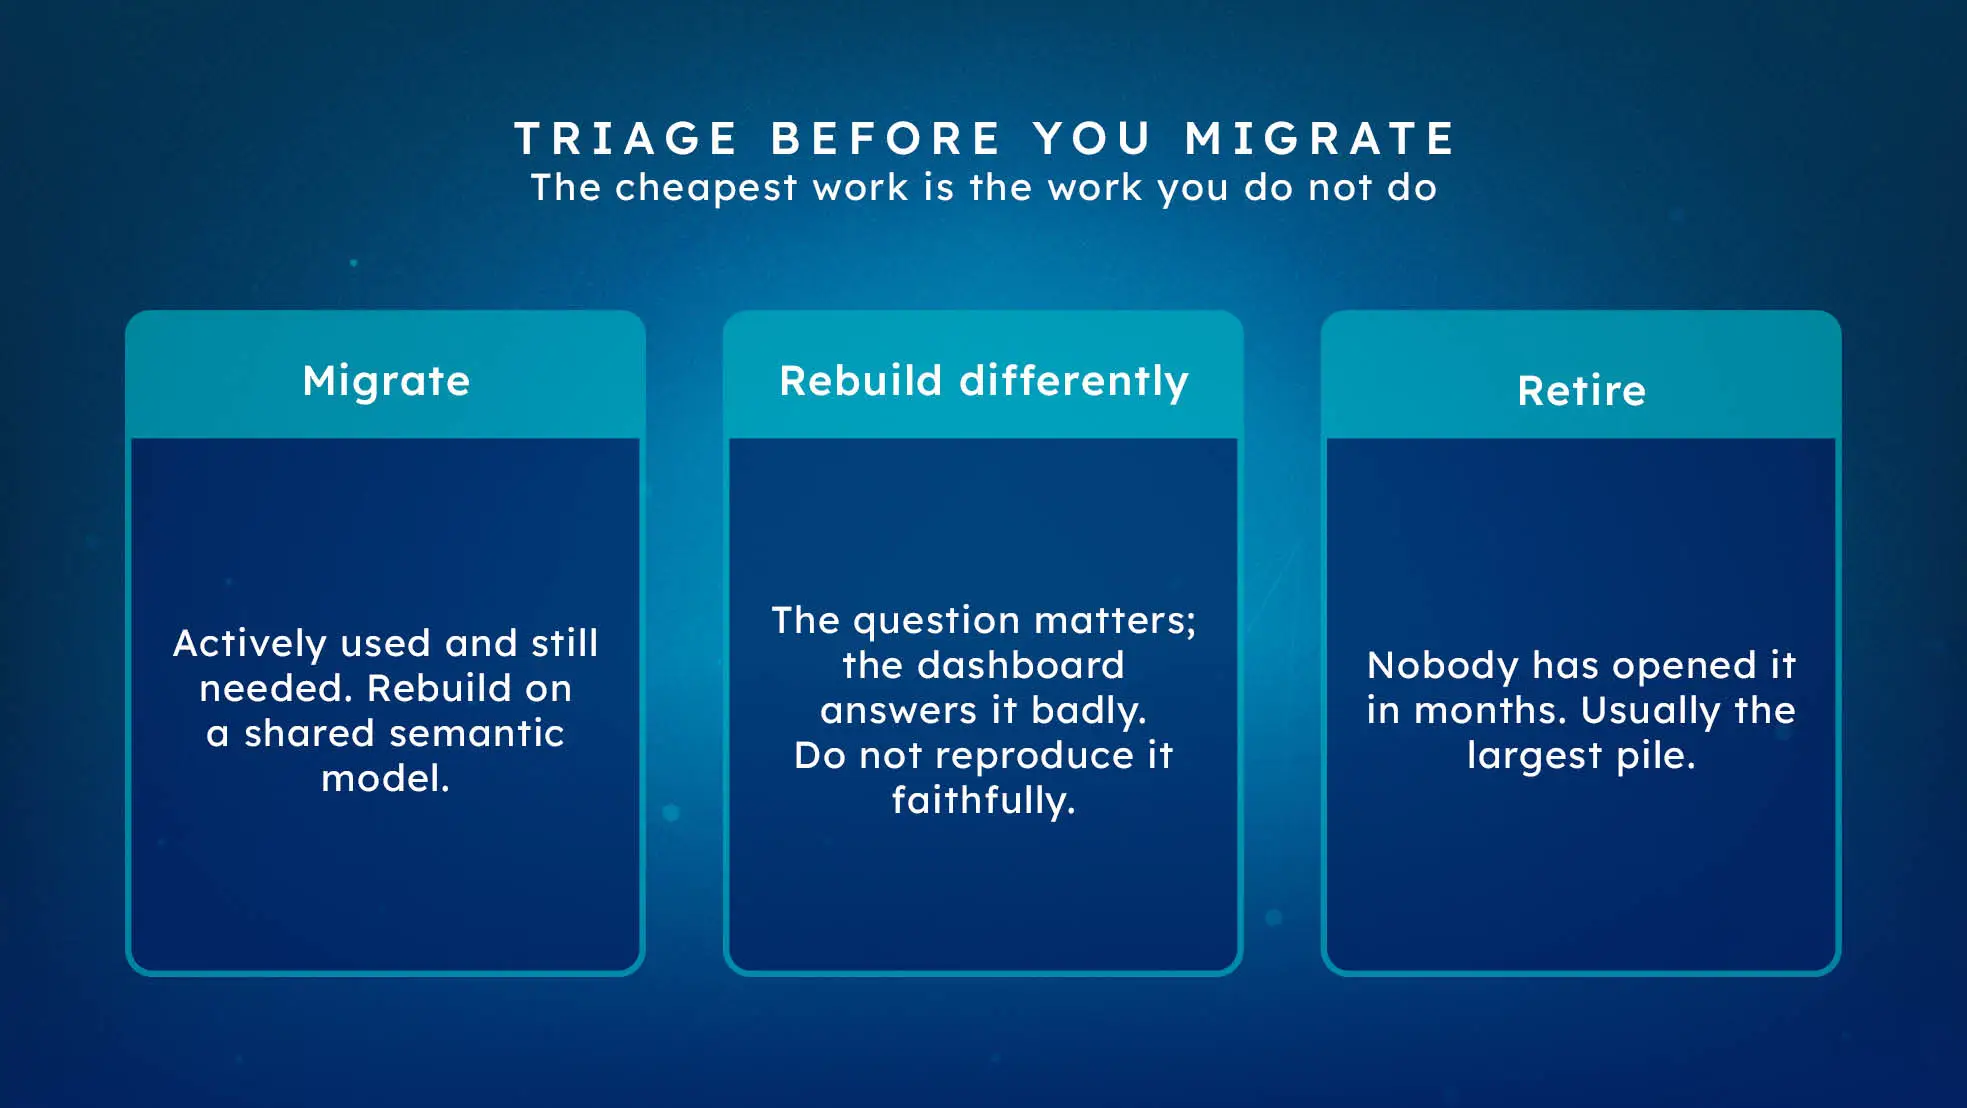
Sort everything into three piles:
- Migrate - actively used and still needed.
- Rebuild differently - the underlying question matters, but the dashboard answers it badly and should not be reproduced faithfully.
- Retire - nobody opens it.
That third pile is usually the largest, and it is the single biggest lever on the cost of the project. It is also worth agreeing formally with stakeholders, because "you deleted my dashboard" arrives later otherwise.
What Actually Transfers
Being clear about this prevents most estimating errors.
Nothing transfers automatically. Data sources are rebuilt as semantic models. Calculated fields are rewritten in DAX. Visuals are recreated.
Concepts transfer well. Aggregations, filters, parameters, standard chart types and most business logic all have clean equivalents. An experienced developer rebuilds a straightforward dashboard quickly because they are translating intent, not syntax.
Three things transfer badly:
Level of Detail expressions. Tableau's LOD syntax has no direct DAX equivalent. Each one needs its intent understood and re-expressed - often as a measure with explicit filter context, sometimes as a change to the model itself.
Table calculations. Tableau computes many of these relative to the visual layout. DAX computes over the model. Results can differ subtly, which is exactly the kind of difference that surfaces during validation rather than during build.
Default behaviours. Tableau and Power BI make different choices about totals, null handling and axis scaling. Producing visually identical output takes deliberate effort, and it is worth asking whether identical is actually the goal.
The Effort, Honestly
Estimate by dashboard, not by data volume:
- Simple - a handful of visuals on one source: one to two days including validation.
- Moderate - multiple sources, parameters, some calculated fields: three to five days.
- Complex - heavy LOD expressions, intricate table calculations, many interactions: a week or more.
Add to that the shared semantic model underneath, which is built once and then serves many dashboards. Front-loading that model is what makes dashboards two onwards fast - and skipping it is what makes a migration produce fifty disconnected datasets and a worse estate than you started with.
The Licence Arithmetic
This is frequently what triggers the project, so it is worth being precise. If you are still weighing the two platforms rather than committed, start with our Power BI versus Tableau comparison.
Power BI Pro is a modest per-user monthly cost for anyone publishing or consuming shared content. The threshold that changes everything is Fabric F64 and above, where report viewers no longer need individual licences at all.
For an organisation with a few dozen creators and several hundred readers, that is often decisive - the capacity costs less than the viewer licences it replaces. Our pricing guide has the full picture, and capacity sizing covers choosing the SKU.
A Sequence That Works
1. Triage by usage. Migrate, rebuild, retire.
2. Build the semantic model first. Start with the domain covering the most dashboards. This is the investment that makes everything after it faster.
3. Migrate one meaningful dashboard. Not the easiest, not the hardest - something real enough to prove the pattern and expose surprises early.
4. Validate against Tableau, number by number. Not a glance at the totals. Where they differ, understand why before proceeding; the difference is often a hidden assumption in the Tableau version worth documenting.
5. Run in parallel, then switch off deliberately. Per dashboard, not per project. A Tableau estate left running "just in case" becomes a permanent second bill and a permanent second source of truth.
The Mistake Worth Avoiding
Recreating Tableau in Power BI. The strong temptation is pixel-fidelity, because it makes acceptance easy and avoids arguments.
It also carries forward every compromise the Tableau version made, and produces reports that feel subtly wrong in Power BI because they are fighting its conventions. Migration is the cheapest opportunity you will ever get to ask whether each dashboard still answers the right question. Take it for the ones that matter - and accept pixel-fidelity where the argument is not worth having.
Where Solv Systems Comes In
We migrate Tableau estates to Power BI, and the part clients find most useful is usually the triage rather than the build - being told which forty percent of the estate nobody opens is worth the conversation on its own.
Beyond that: a governed semantic model built once, dashboards rebuilt on top of it, validation done number by number, and your team trained to extend it rather than depend on us. Migrating from Qlik instead? Our Qlik to Power BI migration guide covers where the approach differs.
Sources and Further Reading
- Power BI documentation
- Star schema guidance for Power BI
- Azure pricing for Microsoft Fabric
- Microsoft Fabric licences
Frequently asked
No, and treat any tool promising otherwise with caution. The products model data and express calculations differently enough that conversion output needs rebuilding anyway. Plan for a rebuild and you will estimate accurately; plan for a conversion and you will not.
Count dashboards, not data. A simple dashboard is typically a day or two to rebuild and validate; a complex one with heavy calculated fields and LOD expressions can be a week. Most of the effort is in the shared semantic model underneath, which is built once and then serves everything.
Level of Detail expressions have no direct DAX equivalent and need rethinking rather than translating. Table calculations map inconsistently. Tableau's default visual behaviours differ enough that visually identical output takes deliberate effort. Data source connections and extracts are rebuilt entirely.
Usually, and the gap widens with audience size. Power BI Pro is a modest per-user cost, and at Fabric F64 and above report viewers need no individual licence at all. That threshold is where the economics often decide the question for organisations with large read-only audiences.
No. Most Tableau estates contain a large share of dashboards nobody has opened in months. Use usage data to triage into migrate, rebuild differently, and retire - the retire list is usually bigger than anyone expects and is the cheapest win in the project.
Yes, and you should. Run Tableau and Power BI in parallel for each migrated dashboard until the numbers reconcile and users have moved. Switch Tableau off deliberately per dashboard rather than in one event.