In Short: What Makes a Qlik Migration Different?
The associative model. Qlik lets users select any value and see what is associated and, distinctively, what is excluded. Power BI filters directionally through defined relationships. Most requirements map fine, but users who explore by exclusion notice immediately. Beyond that, Qlik load scripts often hold substantial business logic that needs relocating upstream rather than recreating in Power Query.
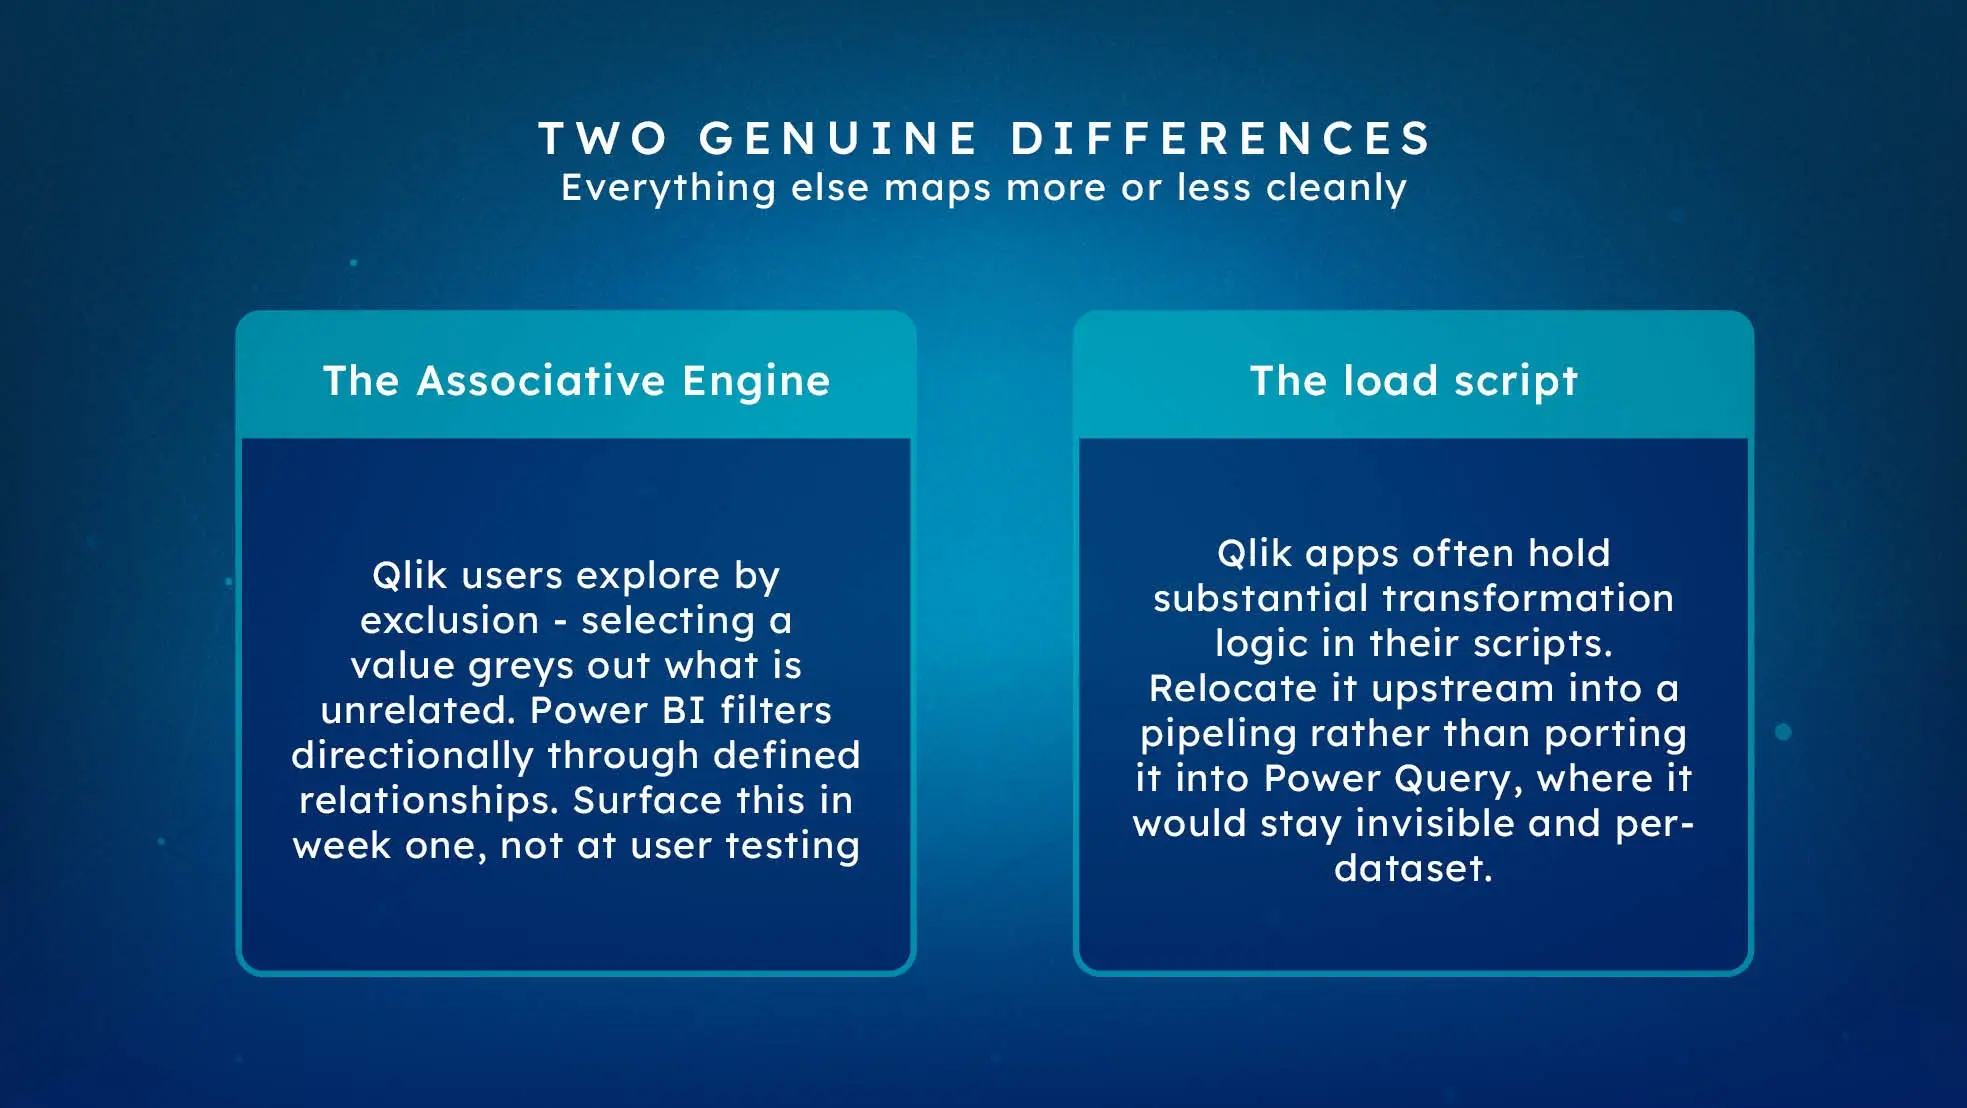
Two Genuine Differences
Most platform comparisons are feature lists. For Qlik there are two differences that actually change the shape of a migration.
The associative engine
In Qlik, selecting a value shows related values and greys out unrelated ones. Users learn to explore by elimination - "which customers did not order this" is a native gesture rather than a report someone builds.
Power BI filters in defined directions through a model you design. Nearly every analytical requirement can be met, but some are met differently, and a few need a deliberately built visual or measure rather than a user gesture.
Surface this early. It is not a blocker, but discovering it at user acceptance testing is considerably worse than discussing it in week one.
The load script
QlikView and Qlik Sense apps commonly contain substantial transformation logic in their load scripts - joins, derivations, cleansing, business rules. In many estates this is the most valuable intellectual property in the platform.
It is also frequently the only place that logic exists. Before touching visuals, read the load scripts and document what they actually do. That exercise routinely uncovers rules nobody currently working there can explain.
Where That Logic Should Go
The instinct is to port load script logic into Power Query. Resist it.
Power Query is per-dataset. Logic there is invisible to everything else, runs on every refresh, and cannot be tested independently. Load-script logic belongs upstream - in a Fabric pipeline, a lakehouse layer, or a view on the source - where it is computed once, reusable, and visible.
This is more work than a like-for-like port and it is the difference between a migration that improves the estate and one that relocates its problems. Our data silos guide covers the target architecture.
Scoping the Work
Two counts drive the estimate, and only one is obvious.
Count the apps, then triage by usage exactly as you would for any migration - a meaningful share of most Qlik estates is unused, and retiring it is free.
Count the business logic. Read the load scripts and assess how much transformation lives in them. An estate with thin scripts over a well-built warehouse migrates quickly. An estate where the scripts are the warehouse is a data engineering project with a reporting layer attached, and should be estimated as one.
Teams that only count apps under-estimate consistently, because the visible artefacts are not where the work is.
The Licence Case
Usually favourable, and most pronounced where many people consume and few create.
Power BI Pro is a modest per-user cost, and at Fabric F64 and above viewers need no individual licence. For an organisation with a large read-only audience, the capacity often costs less than the licences it replaces - see our pricing guide.
Be honest in the comparison though: include the migration cost and the upstream engineering, not just the annual licence delta. A migration that pays back in eighteen months is a good decision; one sold as paying back in three is a disappointment scheduled for later.
Sequence
1. Triage by usage - retire before you migrate. 2. Read and document the load scripts - this is the discovery that matters. 3. Build the upstream layer - relocate transformation logic properly. 4. Build the semantic model on top of it. 5. Rebuild apps one at a time, validating against Qlik. 6. Parallel run, then decommission per app.
Steps two and three are where Qlik migrations differ from Tableau ones, and where the schedule is won or lost.
Setting Expectations With Users
Two conversations, held early, prevent most of the friction.
The exploration gesture will change. Show users the Power BI equivalents of how they work today, and build the specific visuals that cover the exclusion-style questions they rely on.
Some things will be better. Native Excel connectivity to the semantic model, integration with Microsoft 365, and Copilot over governed data are genuine gains. Leading with the losses and never naming the gains makes migration feel like a downgrade to the people who have to live with it.
Where Solv Systems Comes In
Qlik migrations are less common than Tableau ones, which means less competition for the work and rather more scope for a poorly scoped project to go wrong.
We start with the load scripts rather than the dashboards, relocate that logic upstream into Fabric where it belongs, and rebuild reporting on a governed model. The result should be a better data estate than Qlik gave you - not a Qlik-shaped estate rendered in a different product.
Sources and Further Reading
- Fabric Data Factory documentation
- OneLake overview
- Microsoft Fabric documentation
- Azure pricing for Microsoft Fabric
Frequently asked
No. Beyond the visual layer, Qlik's load script and associative engine have no direct Power BI equivalents, so apps are rebuilt. The load script logic is usually the most valuable thing to carry across, and it typically belongs upstream in a pipeline rather than in Power Query.
Qlik lets users select any value and shows what is associated and, distinctively, what is excluded. Power BI filters directionally through defined relationships. Most requirements map fine, but users accustomed to exploring by exclusion notice the difference immediately - it is worth surfacing early rather than at go-live.
Similar to Tableau on a per-app basis, with more work in the data layer because Qlik load scripts often contain substantial transformation logic that has to be relocated. Count apps, then count how much business logic lives in the scripts - the second number usually drives the estimate.
Generally yes, particularly for larger audiences, and the gap is widest where many people consume and few create. At Fabric F64 and above viewers need no per-user licence, which changes the arithmetic substantially for wide deployments.
Move it upstream rather than recreating it in Power Query. A Fabric pipeline or source view makes that logic reusable, testable and visible to everything downstream - which is a genuine improvement on where it lives today.
No. Triage by usage first, retire what nobody opens, then migrate the rest app by app with parallel running until the numbers reconcile. Big-bang platform switches are how migrations acquire a reputation for overrunning.