
In Short: How Should Finance Move From Excel to Power BI?
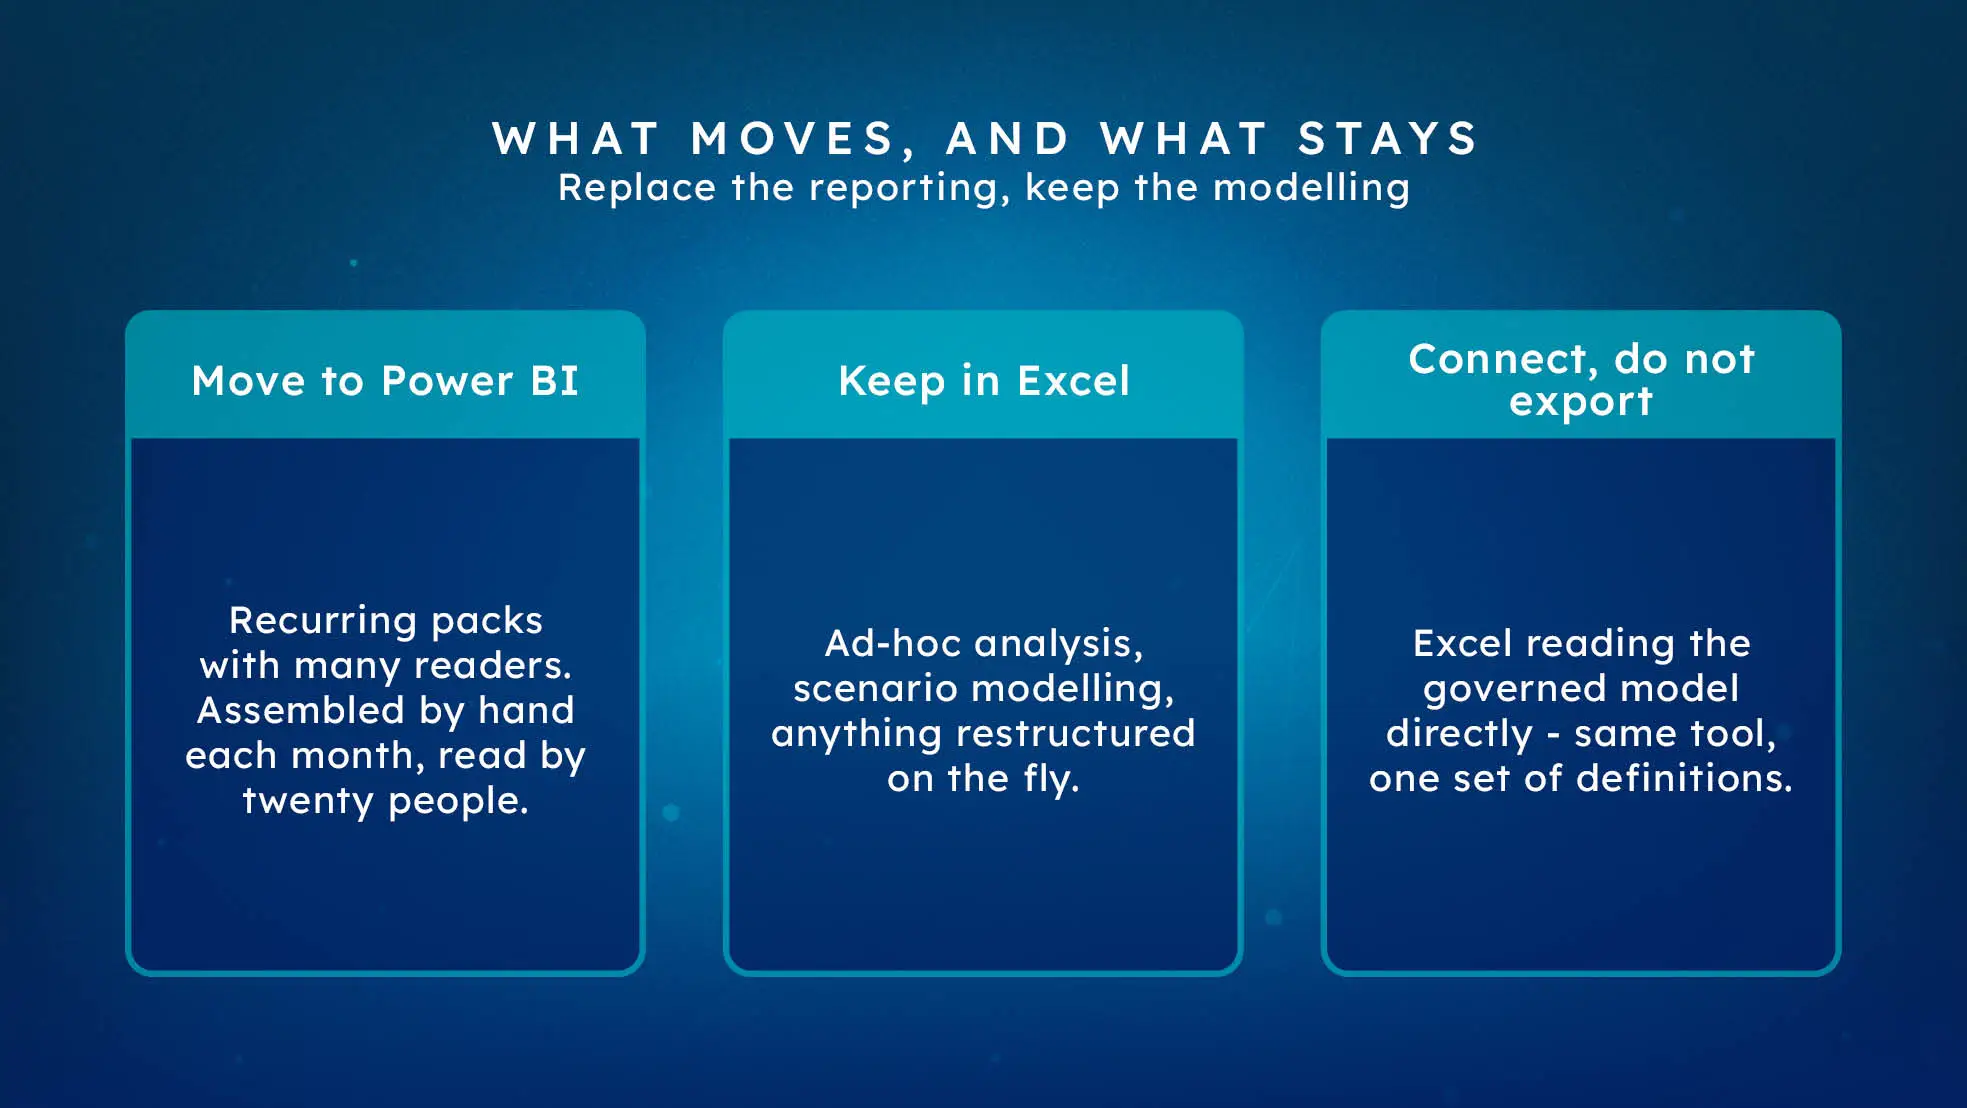
Replace the reporting, keep the modelling. Move the recurring packs that many people read; leave ad-hoc analysis, scenario work and personal working files in Excel where they belong. Agree definitions with finance rather than for them, expect the numbers not to match at first, and treat every difference as an undocumented rule worth capturing.
The Honest Framing
Most Excel-to-Power-BI projects are sold as replacing spreadsheets. That framing is wrong, and finance teams can tell.
Excel is genuinely better at some things: ad-hoc analysis, scenario modelling, anything a professional needs to restructure in the next ten minutes without asking permission. A finance function stripped of that capability will rebuild it in exports, which is worse than where it started.
What Power BI is genuinely better at is distributing consistent numbers to many people, repeatedly, without human assembly. That is the job to move.
What to Migrate First
Recurring, high-readership, high-effort. The monthly pack is almost always the right first target: assembled by hand, circulated to twenty people, and taking someone several days a month - the problem we've written about at length.
Good candidates share three traits: produced on a schedule, read by more people than build it, and assembled from sources that do not change shape often.
Leave alone: one-off analyses, board scenario models, anything with a genuinely bespoke structure each time, and personal working files. Migrating those wastes effort and generates resistance for no gain.
What Changes for the Finance Team
Worth setting out honestly, because unspoken versions of these become objections later.
Definitions get agreed and enforced. Today "revenue" may mean slightly different things in different spreadsheets and nobody notices. In a semantic model it means one thing. That conversation is uncomfortable and it is where most of the value is.
Manual adjustments become visible. Every spreadsheet accumulates corrections applied from memory. These have to be surfaced and either built into the model or dropped. Finance sometimes experiences this as loss of flexibility; it is more accurately loss of undocumented flexibility.
Numbers refresh without anyone assembling them. The pack stops being a construction project. The time released is the point of the exercise.
Control moves rather than disappearing - from controlling the assembly to controlling the definitions. Finance must own the definitions or the project fails, whatever the technology does.
The Reconciliation Phase
Plan for it, because it always happens and unprepared teams read it as failure.
When the Power BI version first runs, the numbers will not match the spreadsheet. The causes, in rough order of frequency:
- An undocumented exclusion - a cost centre someone leaves out, a category treated as an exception.
- A manual adjustment applied every month by the person who builds the pack.
- Timing differences - the spreadsheet used data pulled at a particular moment.
- A genuine spreadsheet error, sometimes long-standing.
Reconcile line by line and document each difference. That document is frequently the most valuable artefact the project produces, because it captures rules that existed only in one person's head.
Where Excel Should Stay
Two patterns work well and are worth designing in deliberately rather than tolerating.
Excel connected to the model. Analysts connect Excel directly to the Power BI semantic model and pivot against governed data. They keep the tool they are fast in; the organisation keeps one set of definitions. This is the single most effective way to end the export habit.
Excel for genuine modelling. Scenario planning, complex allocations and one-off analysis stay in Excel. The distinction to hold is that Excel should consume governed numbers, not create competing ones.
Update, 30 September 2026: Budgeting and forecasting no longer have to leave the governed model. Planning in Microsoft Fabric lets finance build budgets, forecasts and scenarios on existing Power BI semantic models and write them back, and at FabCon Europe 2026 (29 September 2026) Microsoft announced additions including a faster planning engine in preview and write-back into the semantic model. Microsoft's own posts disagree on its status - one says it became generally available in July 2026, another labels it preview. We cover what it is, its status and how it is billed in Planning in Microsoft Fabric, and the wider week in our FabCon Europe 2026 recap.
What you are trying to eliminate is not Excel. It is the export-and-rebuild cycle, which is where conflicting numbers come from.
Update, 30 September 2026: Microsoft's Power BI September 2026 feature summary raises the maximum number of rows exported to Excel from a table visual, using Data with current layout, from 150,000 to 500,000 - listed as generally available. Useful for genuine one-off analysis, but a bigger export is still an export: for recurring work, connecting Excel to the model remains the better habit.
Handling the Holdout
Someone will keep using their spreadsheet. The instinct is to treat this as change resistance; usually it is information.
In our experience the holdout is right about something. Their spreadsheet answers a question the new report does not, or contains a nuance the model dropped, or refreshes at a time that matters. Sit with them, find the actual gap, and either close it or agree explicitly that their analysis stays in Excel on top of the governed model.
Mandating the new report without closing the gap produces compliance in public and a spreadsheet in private.
Fiscal Calendars and Finance Specifics
One technical note that catches teams out: Power BI's automatic date handling cannot support fiscal periods properly. You need a purpose-built date dimension with your fiscal calendar, period offsets and working-day flags in it - see our semantic modelling guide.
Get this in place before building measures. Retrofitting a fiscal calendar after twenty measures depend on the automatic one is avoidable rework.
Where Solv Systems Comes In
Finance is the function we most often start with, because the pain is measurable and the win is visible - a pack that took four days lands the morning after close.
We run the definitional conversation with finance rather than around them, build the model with a proper fiscal calendar, reconcile line by line against the existing spreadsheet, and connect Excel to the governed model so nobody loses the tool they are fast in. The aim is a finance team that trusts the numbers more, not one that has been given a dashboard. For the general comparison beyond finance, see Power BI vs Excel.
Sources and Further Reading
- Power BI documentation
- Endorsing and certifying Power BI content
- Creating measures in Power BI
- Power BI September 2026 Feature Summary
Frequently asked
No - replace the reporting, keep the modelling. Power BI is better at distributing consistent numbers to many people; Excel remains better at ad-hoc analysis, scenario work and anything a finance professional needs to restructure on the fly. Teams that try to eliminate Excel entirely usually end up with a shadow estate of exports.
The recurring ones with many readers. A monthly pack assembled by hand and circulated to twenty people is the ideal first candidate: high effort, high visibility, and the before-and-after is obvious. Leave one-off analyses and personal working files alone.
Only if it is done to them rather than with them. The definitions must be agreed with finance and owned by finance, and the model has to be legible enough that they can trace a number back. Done properly they gain control, because the calculation is enforced rather than re-keyed each month.
Yes for the common ones - fiscal calendars, period comparisons, running totals, variance analysis, hierarchical reporting - though fiscal periods need a proper date dimension rather than Power BI's automatic date handling. Statutory consolidation and complex allocations sometimes stay in a dedicated system, with Power BI reporting on the output.
Expect it, and treat it as valuable. Differences almost always reveal an undocumented adjustment in the spreadsheet - an exclusion, a manual correction, a rule someone applies from memory. Reconcile line by line and document each difference; that exercise is often worth more than the report.
Usually a signal that the new report does not answer their actual question, not that they are being difficult. Sit with them, find the question, and either serve it or agree explicitly that their analysis stays in Excel on top of the governed model.